With users becoming more sensitive to delays, even a 0.1 sec of improvement can increase your conversion rate by 10.1%. That’s why profiling has become one of the main steps in our development life cycle. Using the right profiling tools allows for spotting the source of performance problems and makes it easier to find a solution that actually makes a difference – and satisfied users mean better business results.
Profiling iOS
Profiling is essential to understanding the runtime performance of the app through analysis that measures the memory or time complexity, frequency, and duration of function calls, etc. Getting all this information helps you track down and provide proper solutions to keep your app healthy and your users engaged.
Xcode provides some basic tools to do the first report. You can monitor the CPU, Memory, and Network.
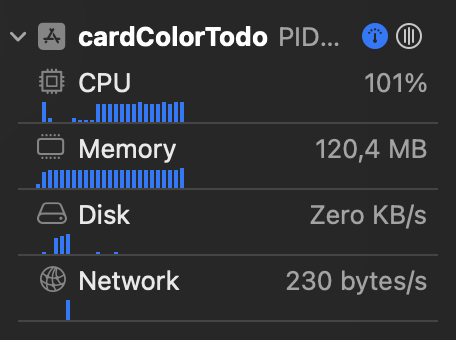
CPU Monitor measures the amount of work done. Memory Monitor is for observing the use of the app. All iOS devices use SSD for permanent storage, accessing this data is slower compared to RAM. Disk Monitor is for understanding your app’s disk-writing performance. Network Monitor analyzes your iOS app’s TCP/IP and UDP/IP connections. You can tap on each of them to find more information.
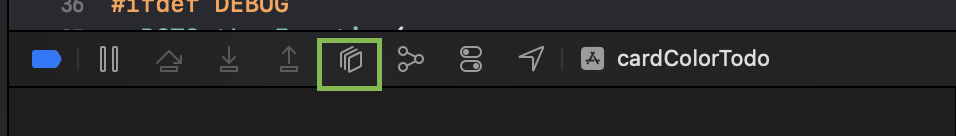
It also provides an extra monitor that isn’t shown by default but can help you inspect your UI - it's the View Hierarchy. When the app is running, and you are on the screen you want to inspect, click on Debug View Hierarchy.
This will show your current UI in a 2D/3D model and the view tree.
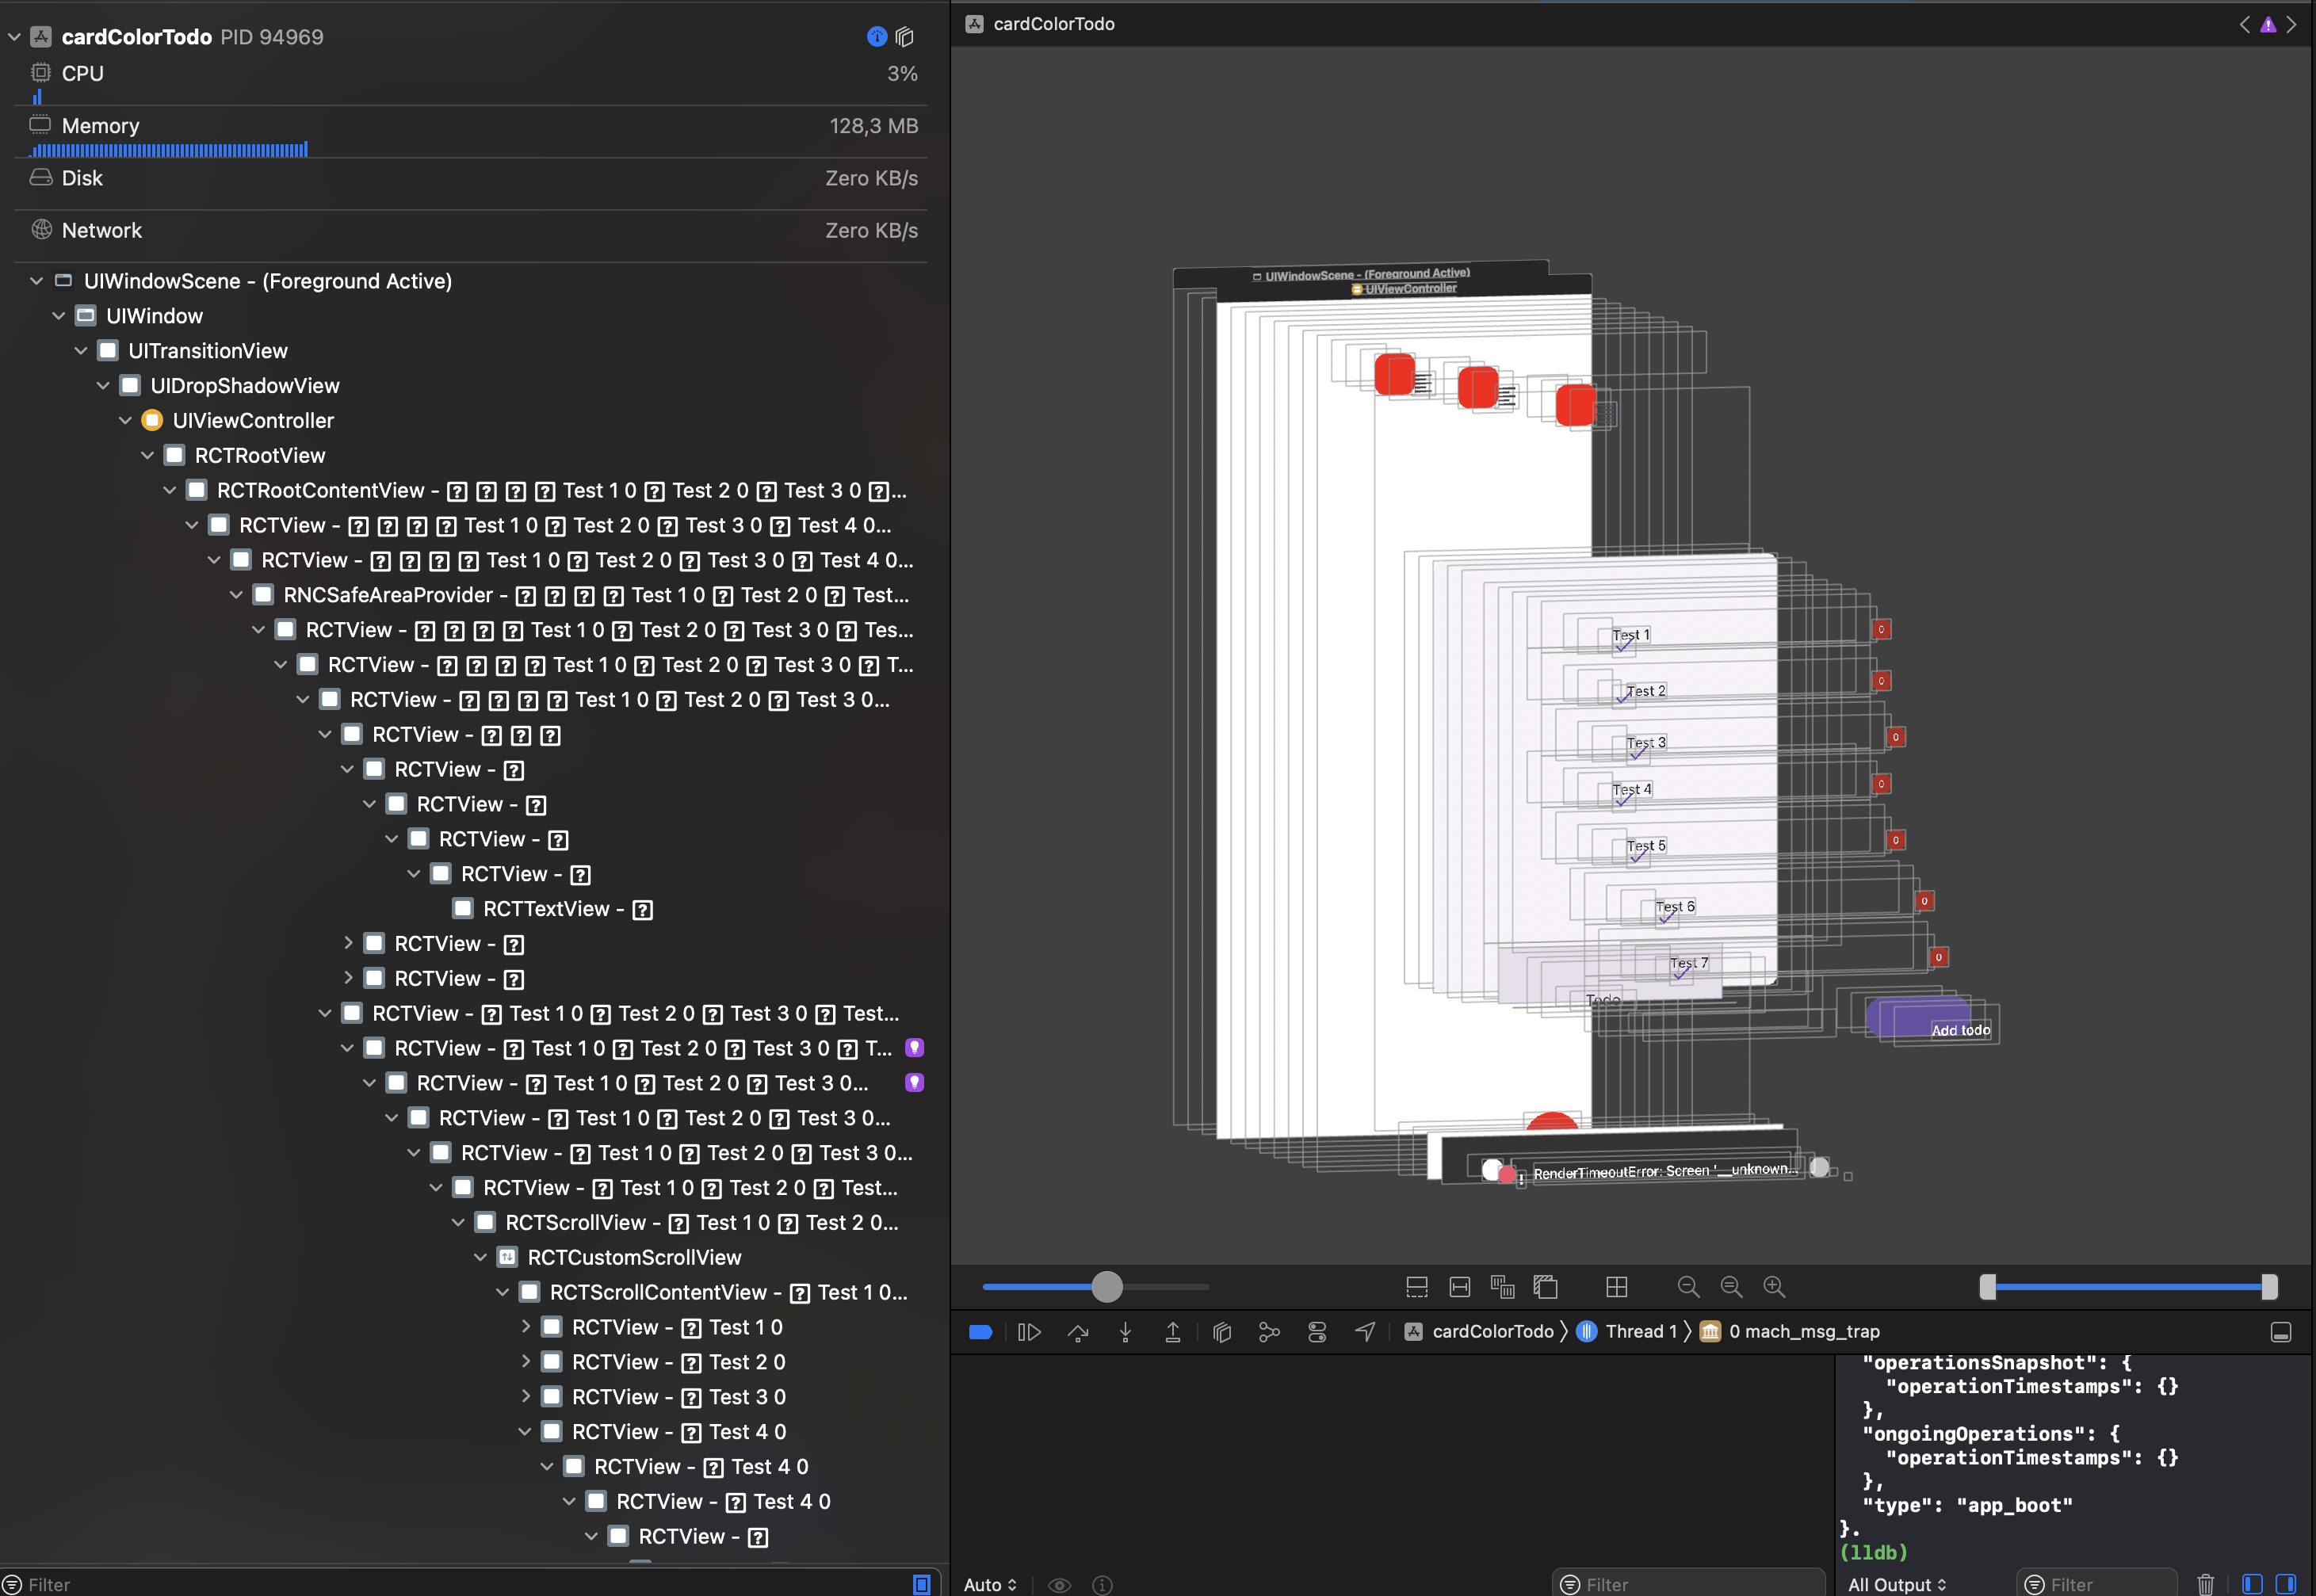
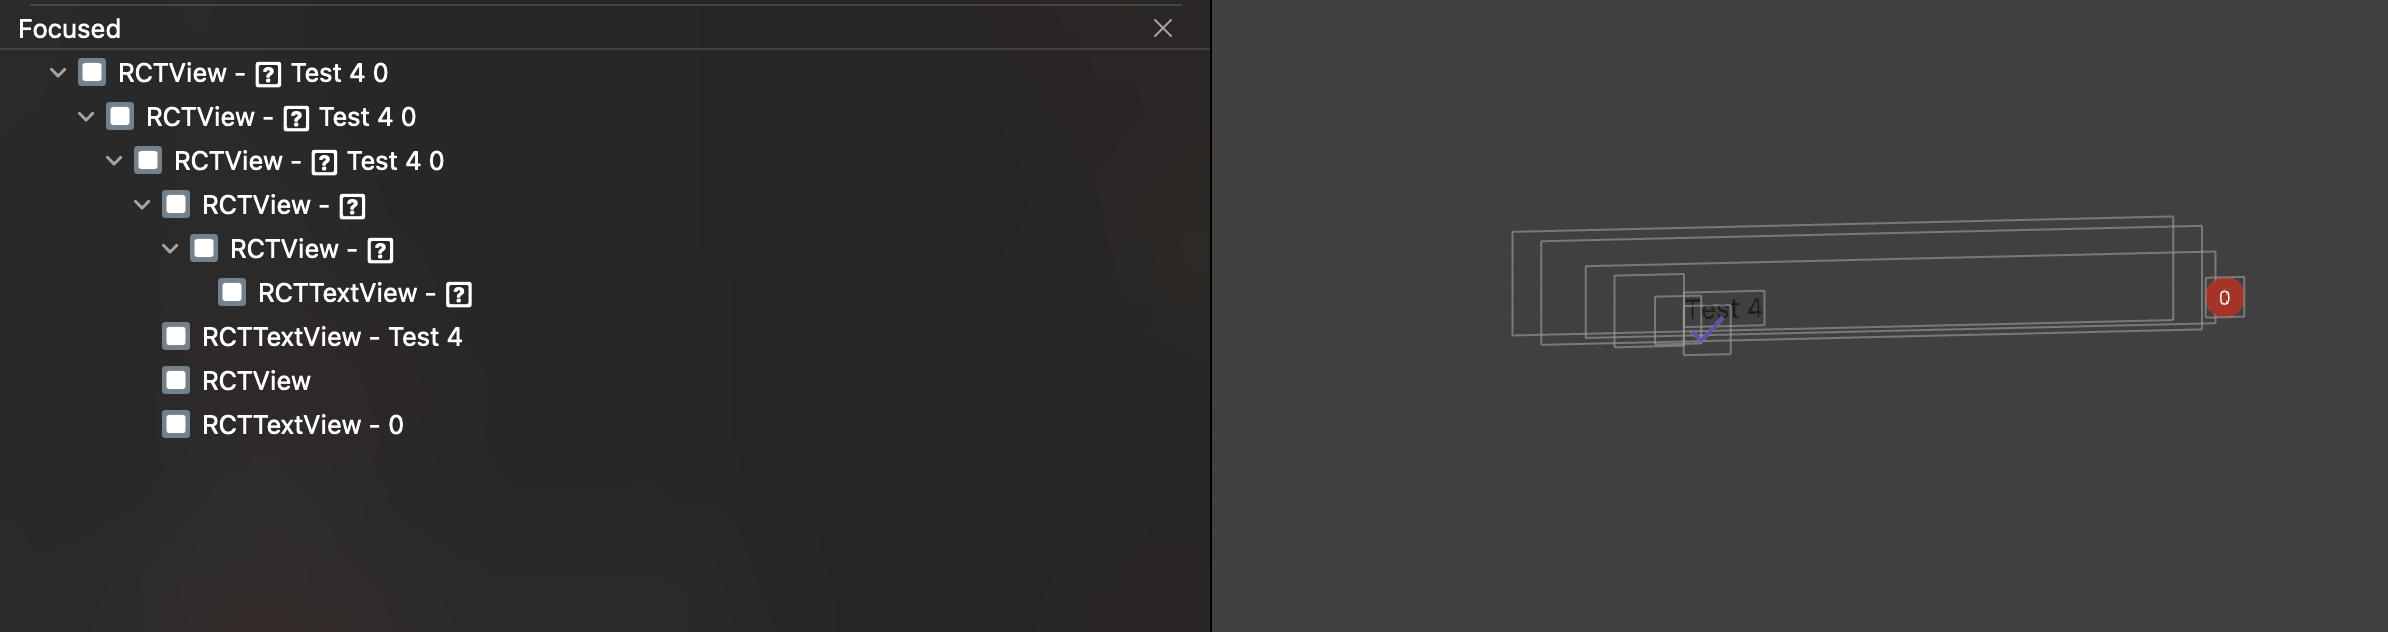
This will help you to detect overlappings (you can’t see a component) or if you want to flatten your component tree. Even though RN does a view flattening, it sometimes can’t do it with all of them, so here we can do some optimization focusing on specific items.
Let’s say we have a TODO list app, and when the Add button is pressed, it adds the new item to the list. However, it takes a couple of seconds to show up on the list because there is some logic before the item is added. Let’s go to our dev toolbox and pick up our first instrument so we can confirm and measure the delay.
Profiling and debugging React Native app with iOS Instruments
Instruments is a debugging and profiling tool that comes prepackaged with Xcode and is literally a box of tools, each of them serving a different purpose. You choose from a list of templates, and you choose any of them depending on your goal: improving performance or battery life or fixing a memory problem.
We are going to use Time Profiler. Let’s dive into it. With Xcode open, we go to Open Developer Tool -> Instruments. Then, scroll down to find the Time Profiler tool.
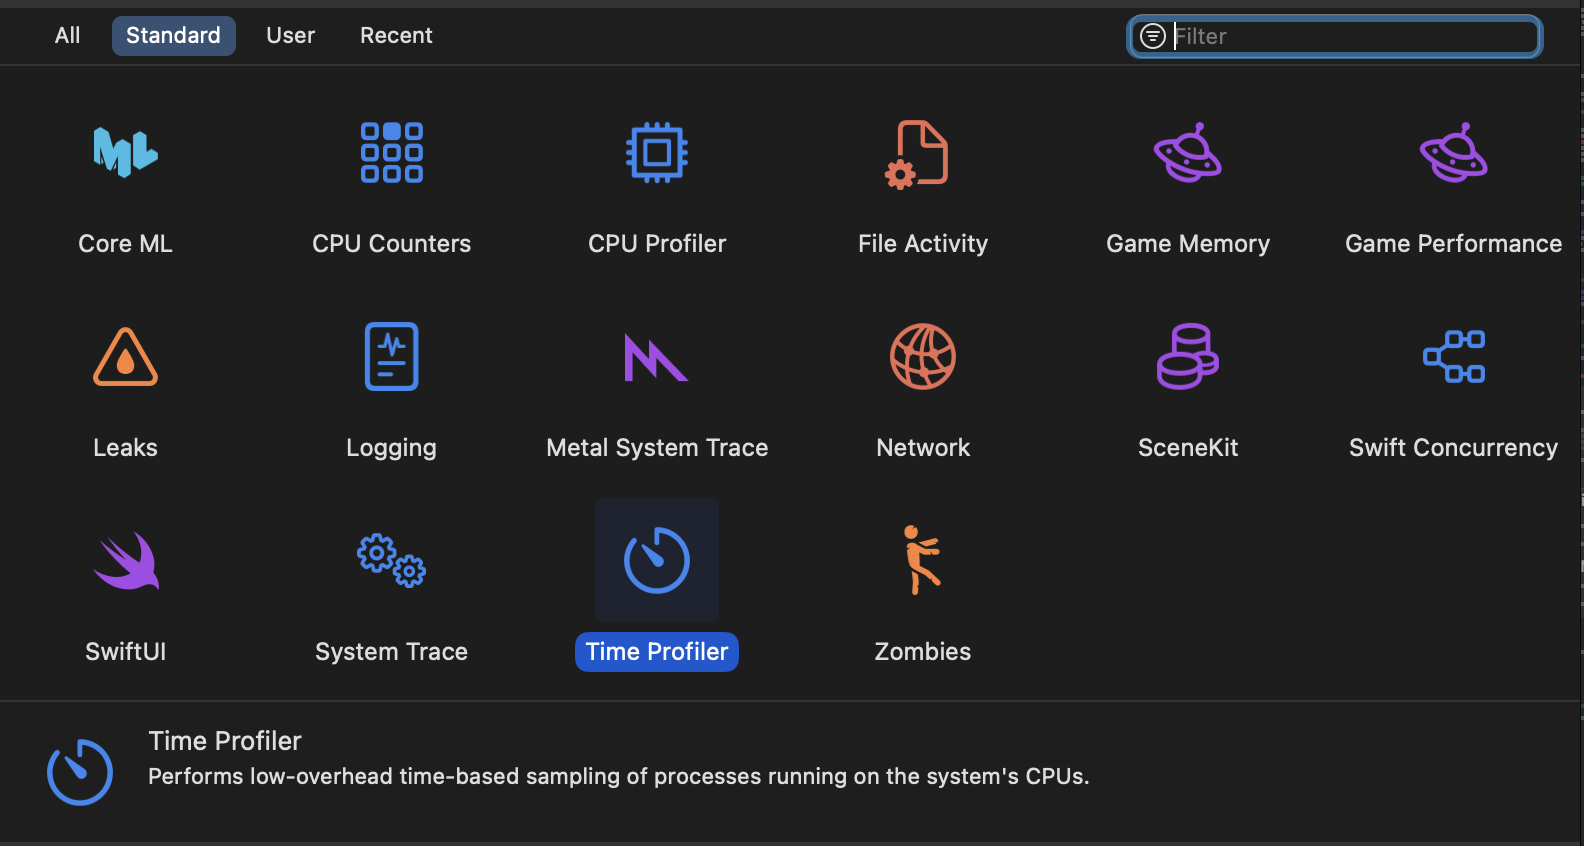
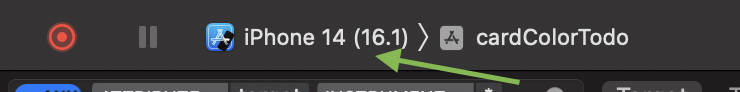
It will open a new window. To start profiling your app, click on the drop-down menu and select your device and the app.
When the app opens, start using it normally, or in this case, add a new TODO item.
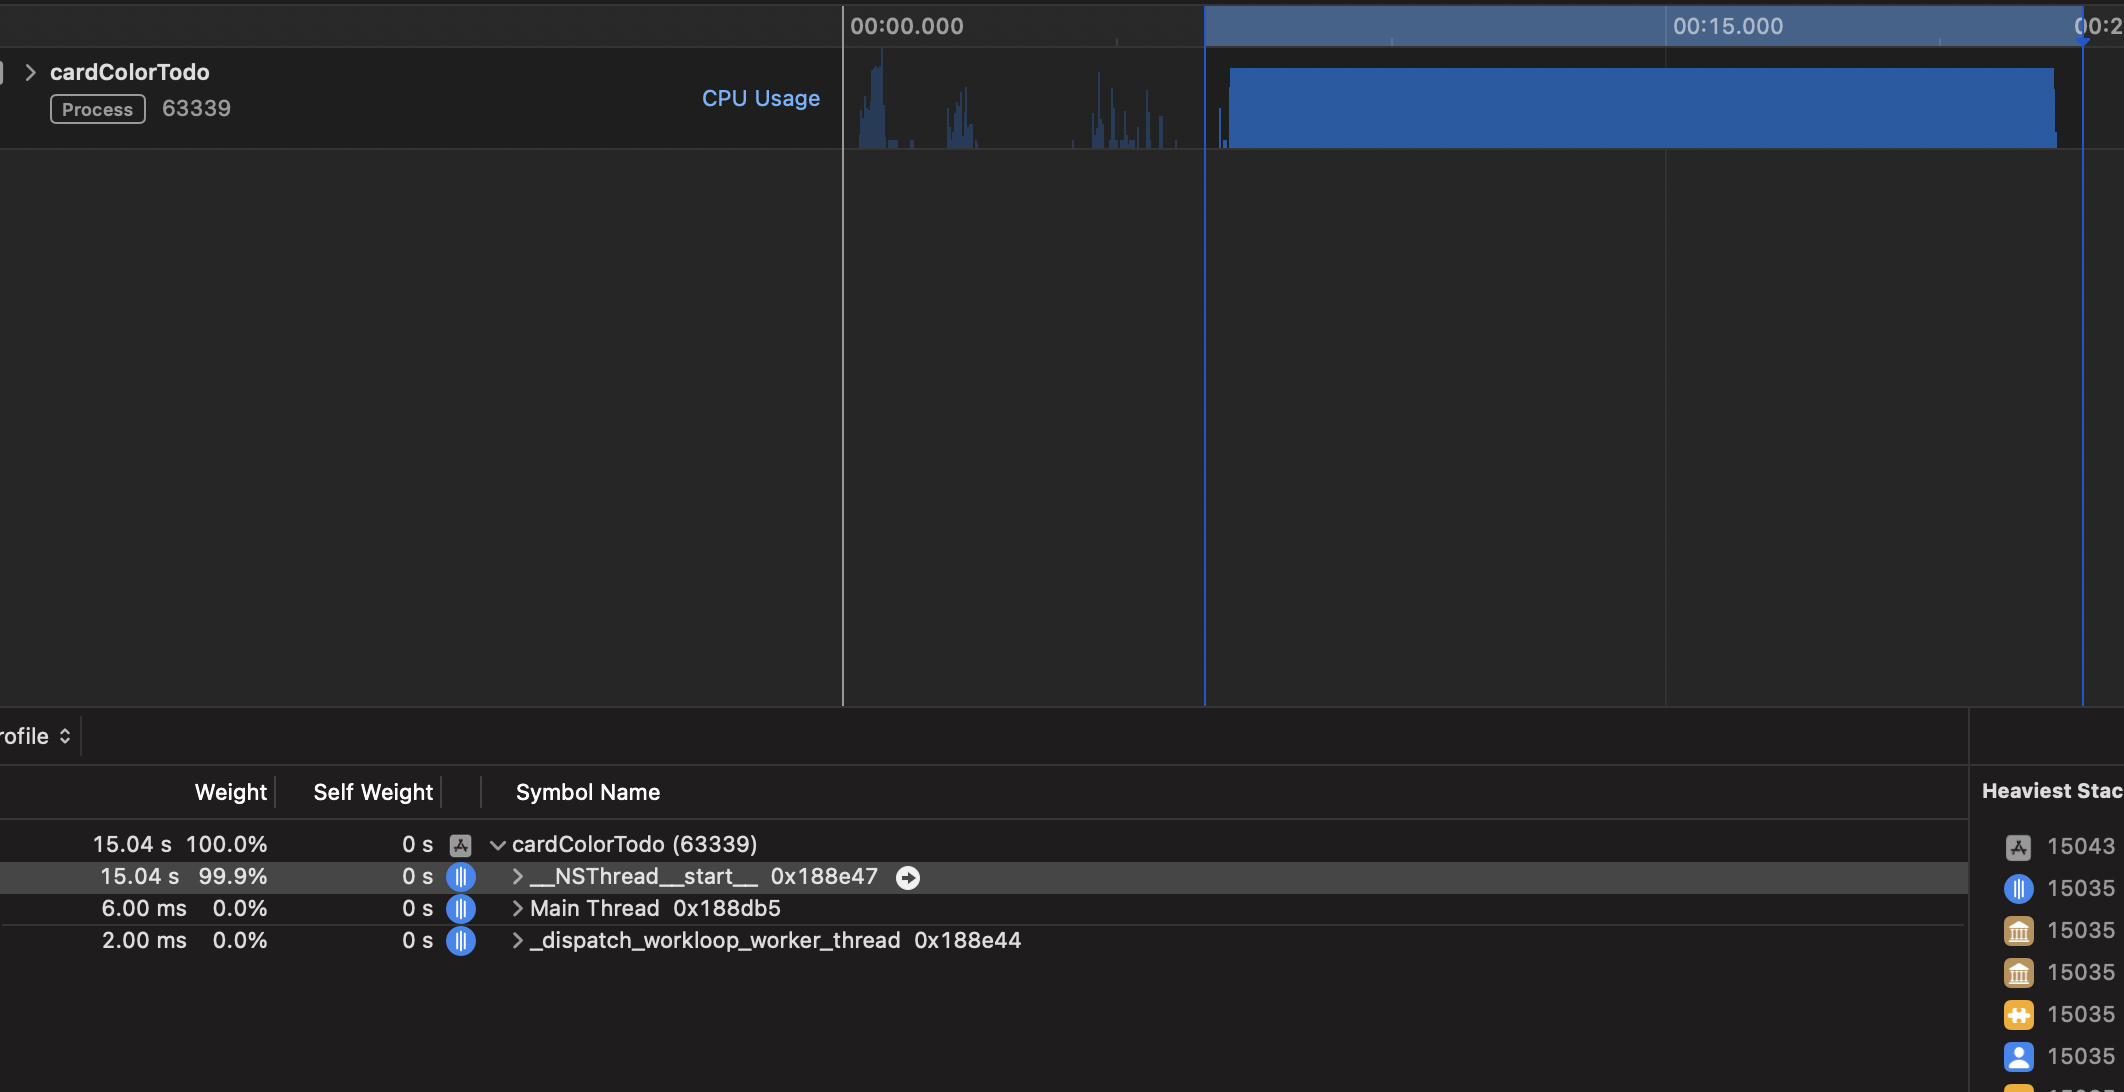
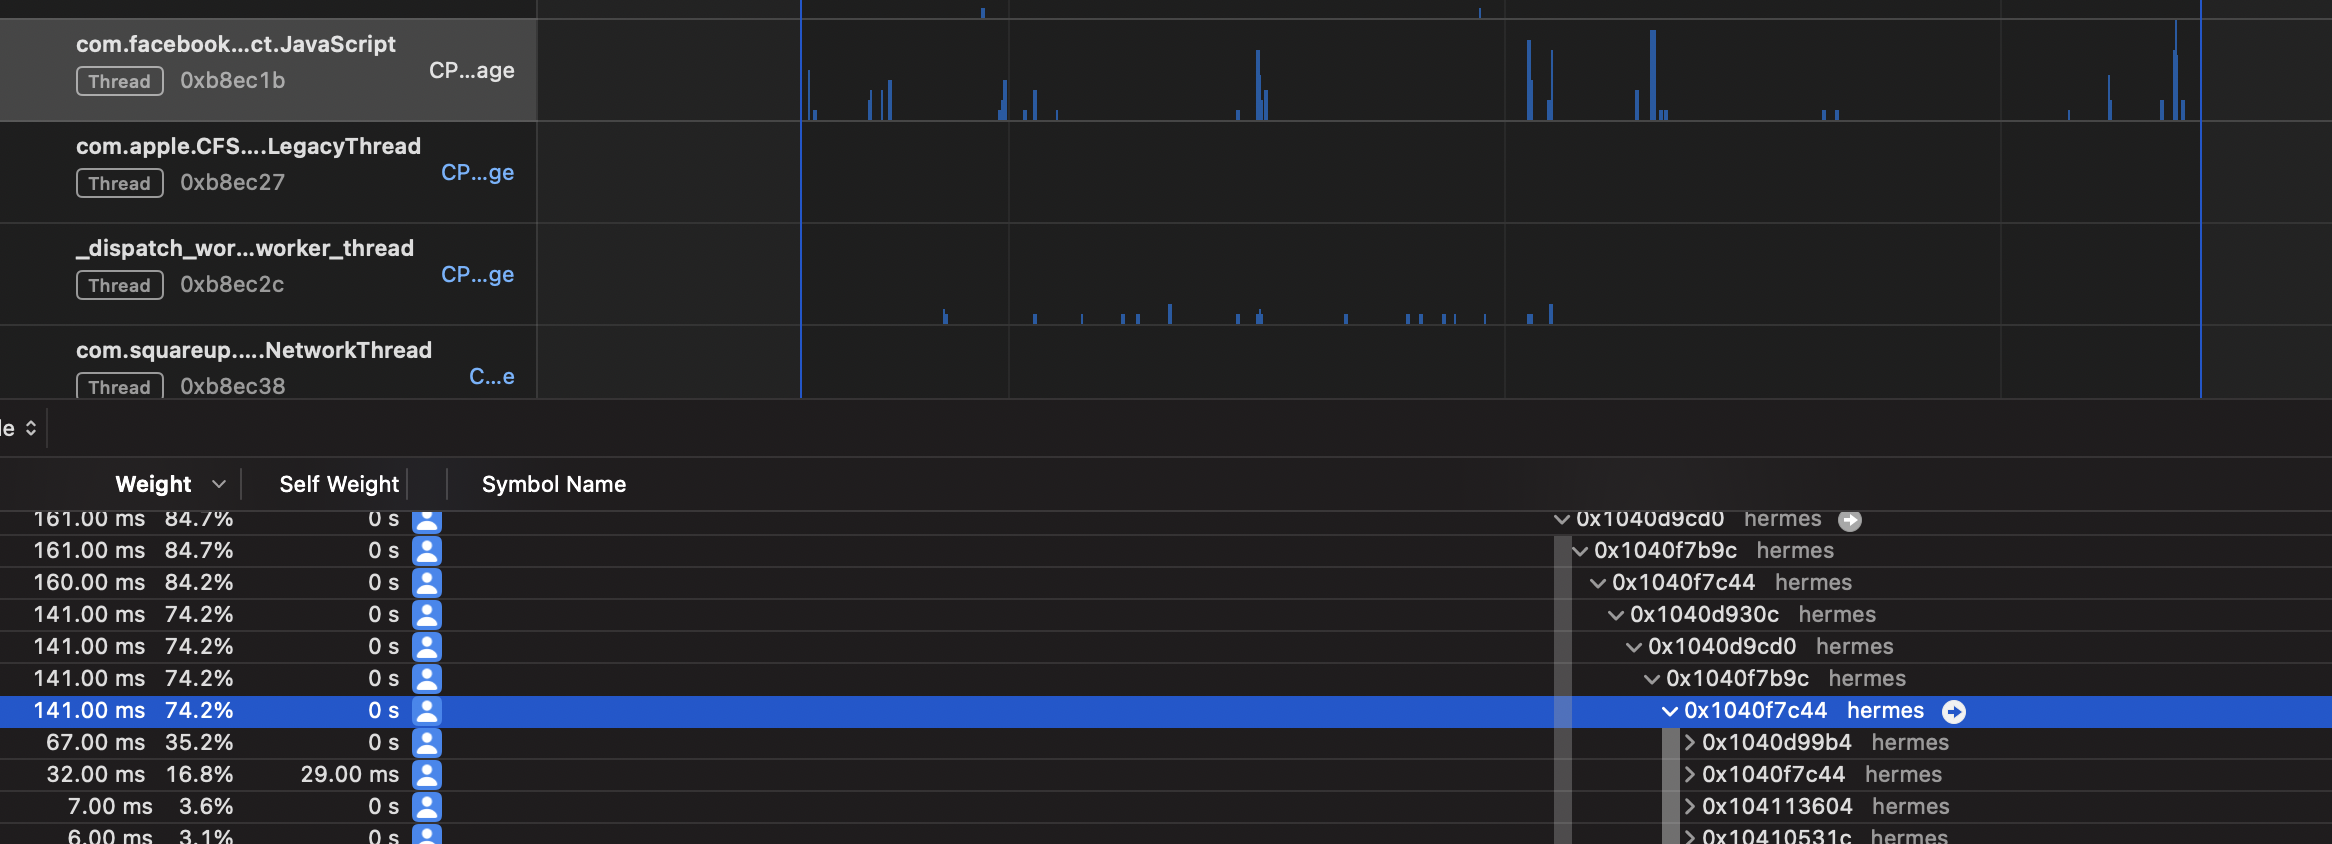
After playing around and adding the new TODO item, we can see there is a big blue rectangle, which means there is something that is taking a lot of time to finish. Let’s take a look at the threads.
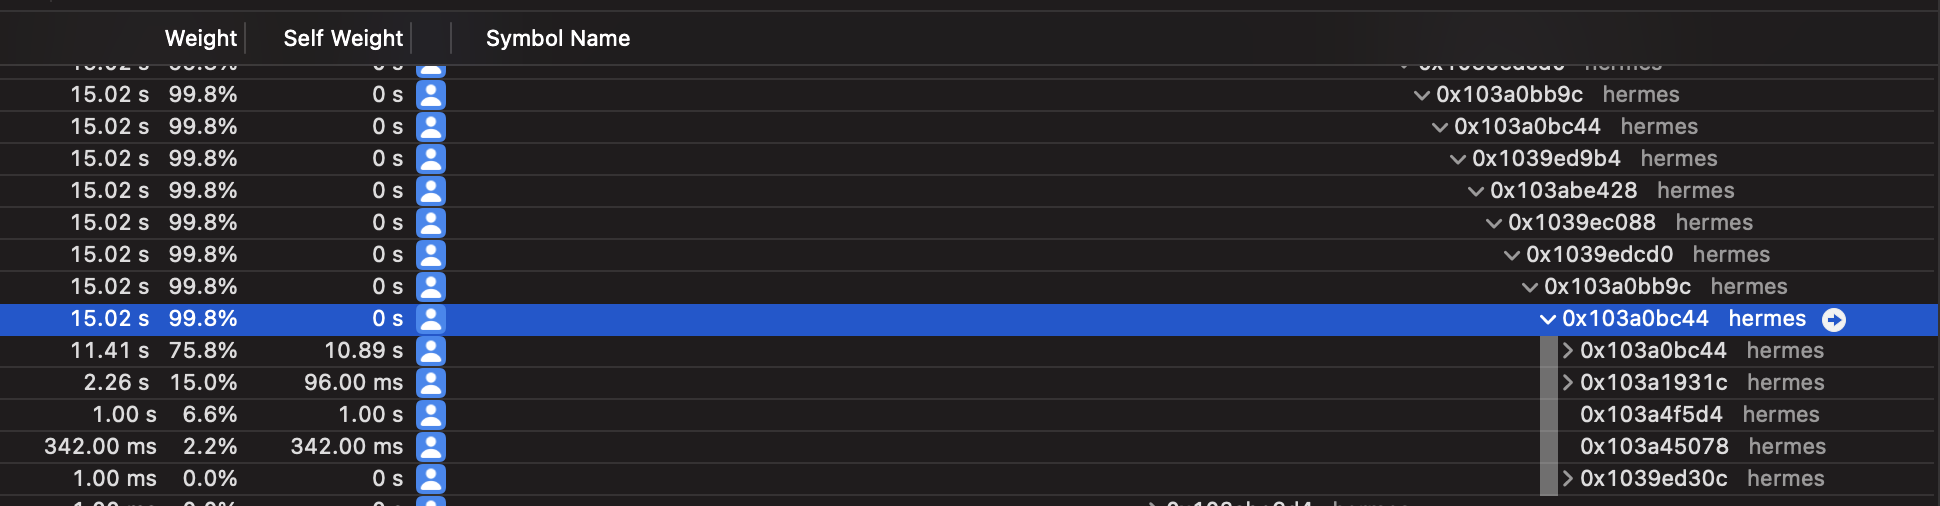
You can expand by pressing option+click over the chevron, which will expand to display useful information. At least for now, it is showing the memory address, but we will need to find another way to find where the problem is.
Combining with a tool specific for JS Context tracking
Let’s use Flipper and pair it with a monitor called Hermes Debugger (RN). With the app open and running, we go to Flipper, select the running app if not selected already, and go to Hermes Debugger (RN) -> Profiler.

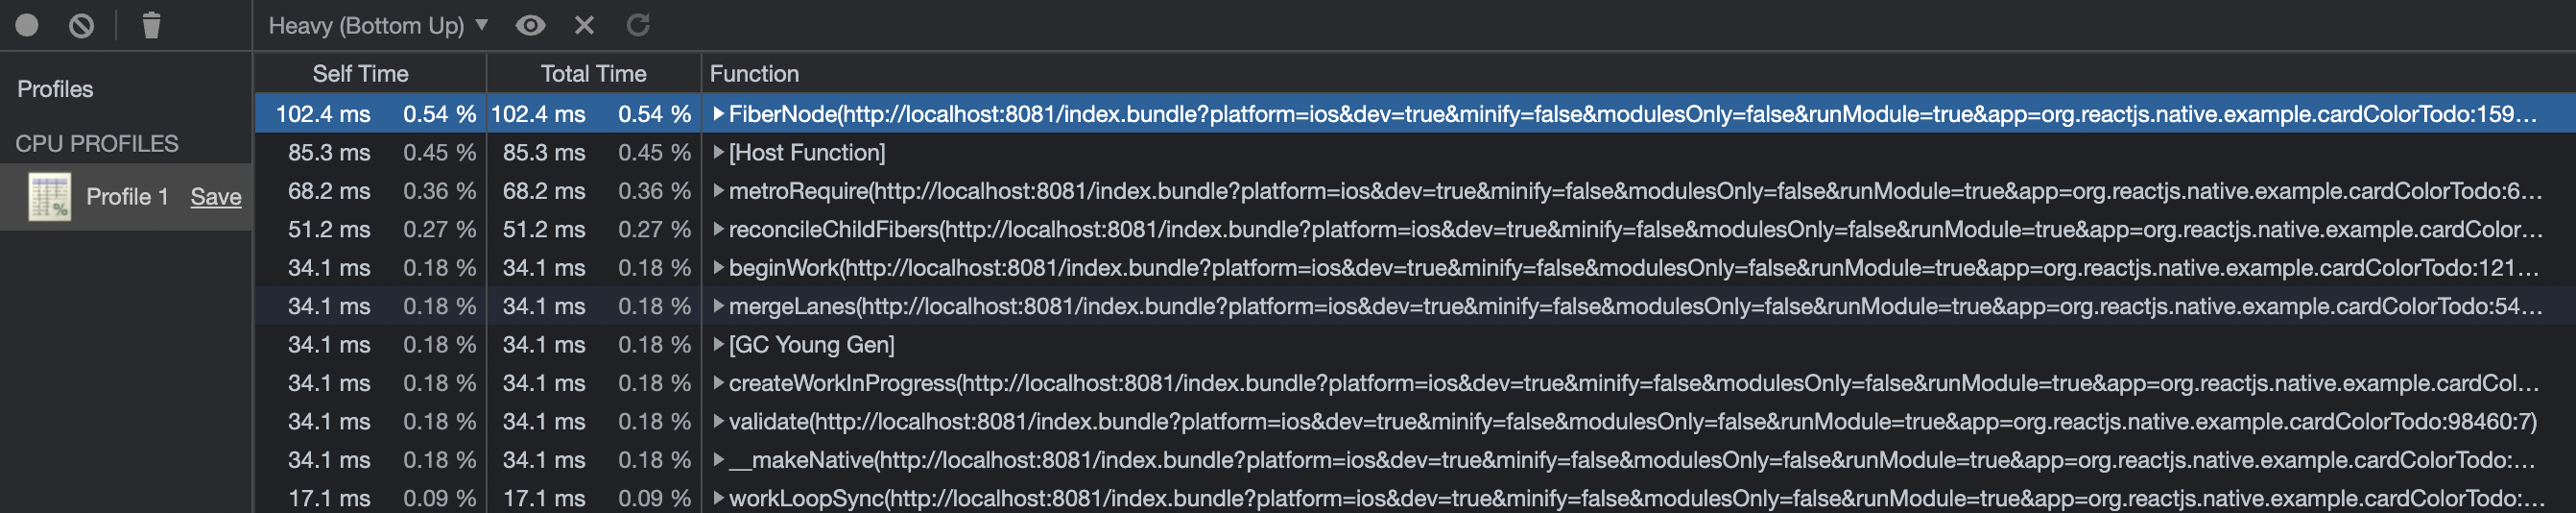
We click start so the profiler begins. We do the same flow and actions as before when profiling with Time Profiler. When we Stop, we will see all the data collected.
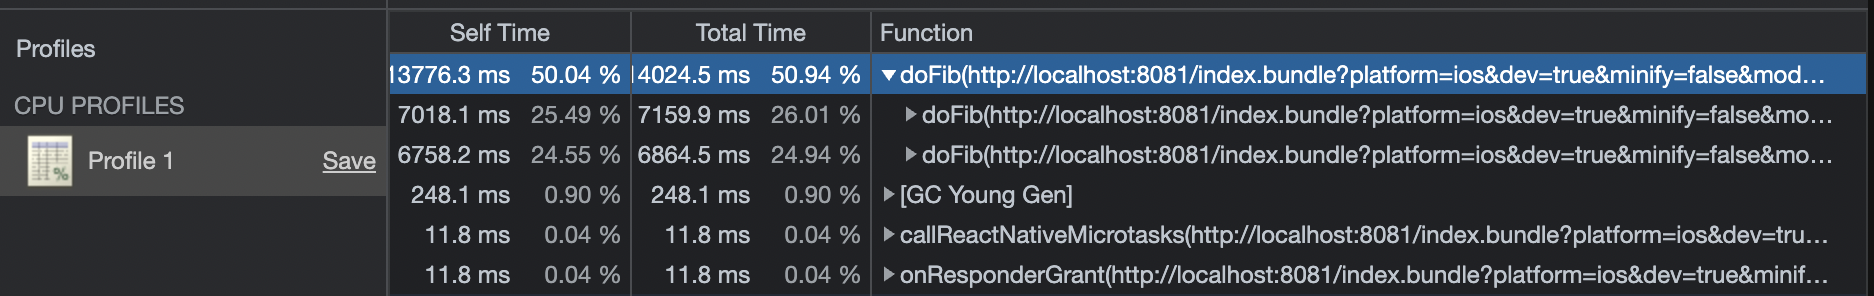
By default, the data will be sorted bottom-up with the heavy tasks at the top. We can see that a function called doFib is taking ~14 sec to complete, it is a good start. Let’s go into that function and see what we can do. The fixes will vary depending on your code.
After applying a possible fix, we first check Time Profiler again. We click on the record button and start using the app; in our case, let's add a new TODO item.
As we can see, the fix we applied did work, we don't see the big blue rectangle like before. This is a good sign. Let’s continue with our profiling path to check how it looks in Flipper.
Start profiling the app one more time using Hermes Debugger (RN) -> Profiler.
We don’t see the doFib function anymore, only other expected RN tasks.
Introduction to prewarming in iOS 15
Prewarming, introduced in iOS 15, impacts the user experience by minimizing the delay before an app becomes operational. This process launches inactive application processes ahead of time, enabling the system to construct and cache vital low-level structures for a swift full launch. It transforms traditional notions of startup time measurement, as it may activate processes well before the user actually opens the app. For instance, if a user habitually starts an app every day at 8 am, iOS might preemptively initiate certain processes around 7:50 am to align with the user’s anticipated behavior.
Early stages of app launch
Prior to the execution of the app’s main function and +applicationDidFinishLaunching, iOS undertakes considerable preparatory work. This involves initializing dynamic libraries (dylibs), executing +load methods, and more, a process that could extend beyond a second. Grasping this procedure is essential for developers focused on optimizing their app’s launch efficiency.
Prewarming mechanics
During prewarming, the app’s launch sequence remains suspended either until a complete app launch is initiated or when the system, needing to free up resources, removes the prewarmed app from memory. Such prewarming can be triggered following a device reboot or intermittently, depending on the system’s status.
Special handling for iOS 15’s prewarming
With the advent of iOS 15, initializers and other preparatory steps can be executed hours ahead of the actual app startup. Developers must, therefore, account for the interval between the commencement of the process in the pre-main initializer and the subsequent post-main period. Otherwise, they may notice a lot of very high numbers in their monitoring tools.
Distinguishing prewarming in Objective-C and Swift
Developers can utilize the ProcessInfo environment variable to ascertain whether prewarming has occurred. This helps tailor the app’s behavior based on the prewarming status. The following snippets enable developers to detect if the app was launched through prewarming and adjust their startup measurements accordingly.
Profiling Android
In the event of any performance issues, we mostly use React Profiler to troubleshoot and resolve our problems. Since most of the performance problems originate from the JS realm, we don’t usually need to do anything beyond that. But sometimes, we’ll encounter a bug or performance issue that comes directly from the Android runtime. In such a case, we’ll need a fine tool to help us gather the following metrics from the device:
- CPU
- memory
- network
- battery usage
Based on that data, we can check whether our app consumes more energy than usual or, in some cases, uses more CPU power than it should. It is useful especially to check the executed code on lower-end (LE) Android devices. Some algorithms can run faster on some devices, and the end user will not spot any glitches, but we have to remember some customers can use LE devices, and the algorithm or function can be too heavy for their phones. High-end devices will handle it because their hardware is powerful.
Profiling your React Native app with Android Profiler in Android Studio
Android Studio is the IDE developed by JetBrains. It is officially supported by Google and the official IDE, which can be used to develop any Android app. It is very powerful and contains lots of functionalities in one place. One of those tools is Android Profiler.
If you have not installed Android Studio yet, you can install it from the Android studio.
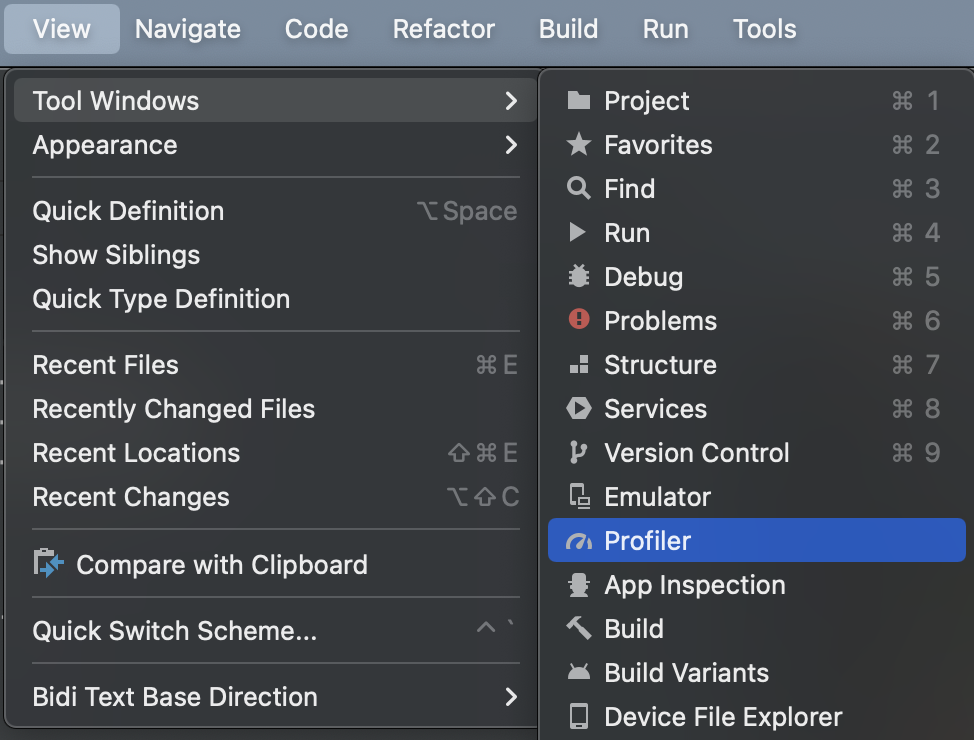
To open the Profiler, choose View > Tool Windows > Profiler from the Android Studio menu bar:
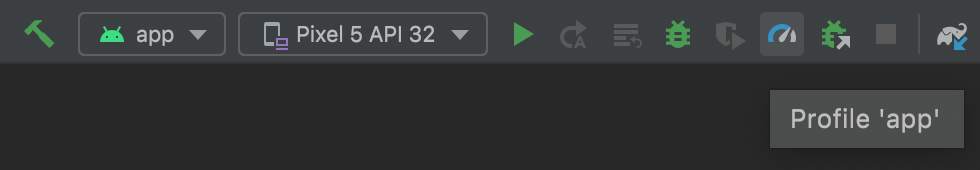
Or click Profile in the toolbar.
Before you start profiling the app, remember:
- Run the app on a real Android device that is affected, preferably a lower-end phone or emulator if you don’t have one. If your app has runtime monitoring set up, use a model that is either the most used by users or the one that’s affected by a particular issue.
- Turn off development mode. You must be sure that the app uses a JS bundle instead of the metro server, which provides that bundle. To turn it off, please share your device, click onSettings and find JS Dev Mode:

After that, go to the Profiler tab and add a new profiler session:
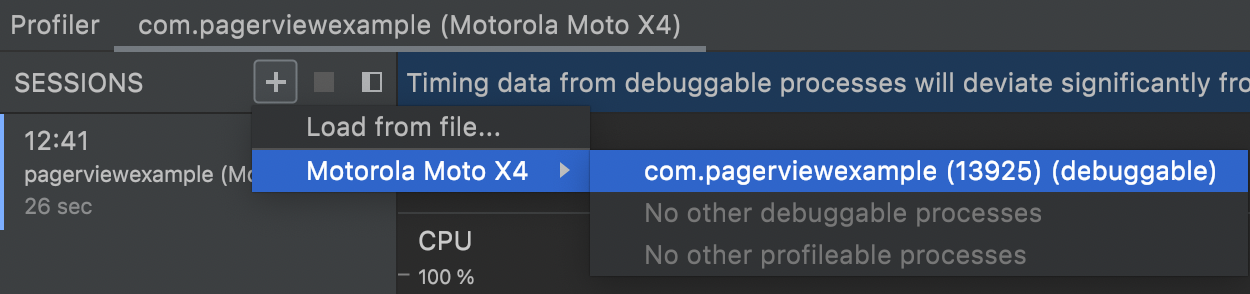
Wait for the session to attach to your app and start performing actions that could cause some performance issues, like swiping, scrolling, navigating, etc. Once you’re done, you should see some metrics like these:
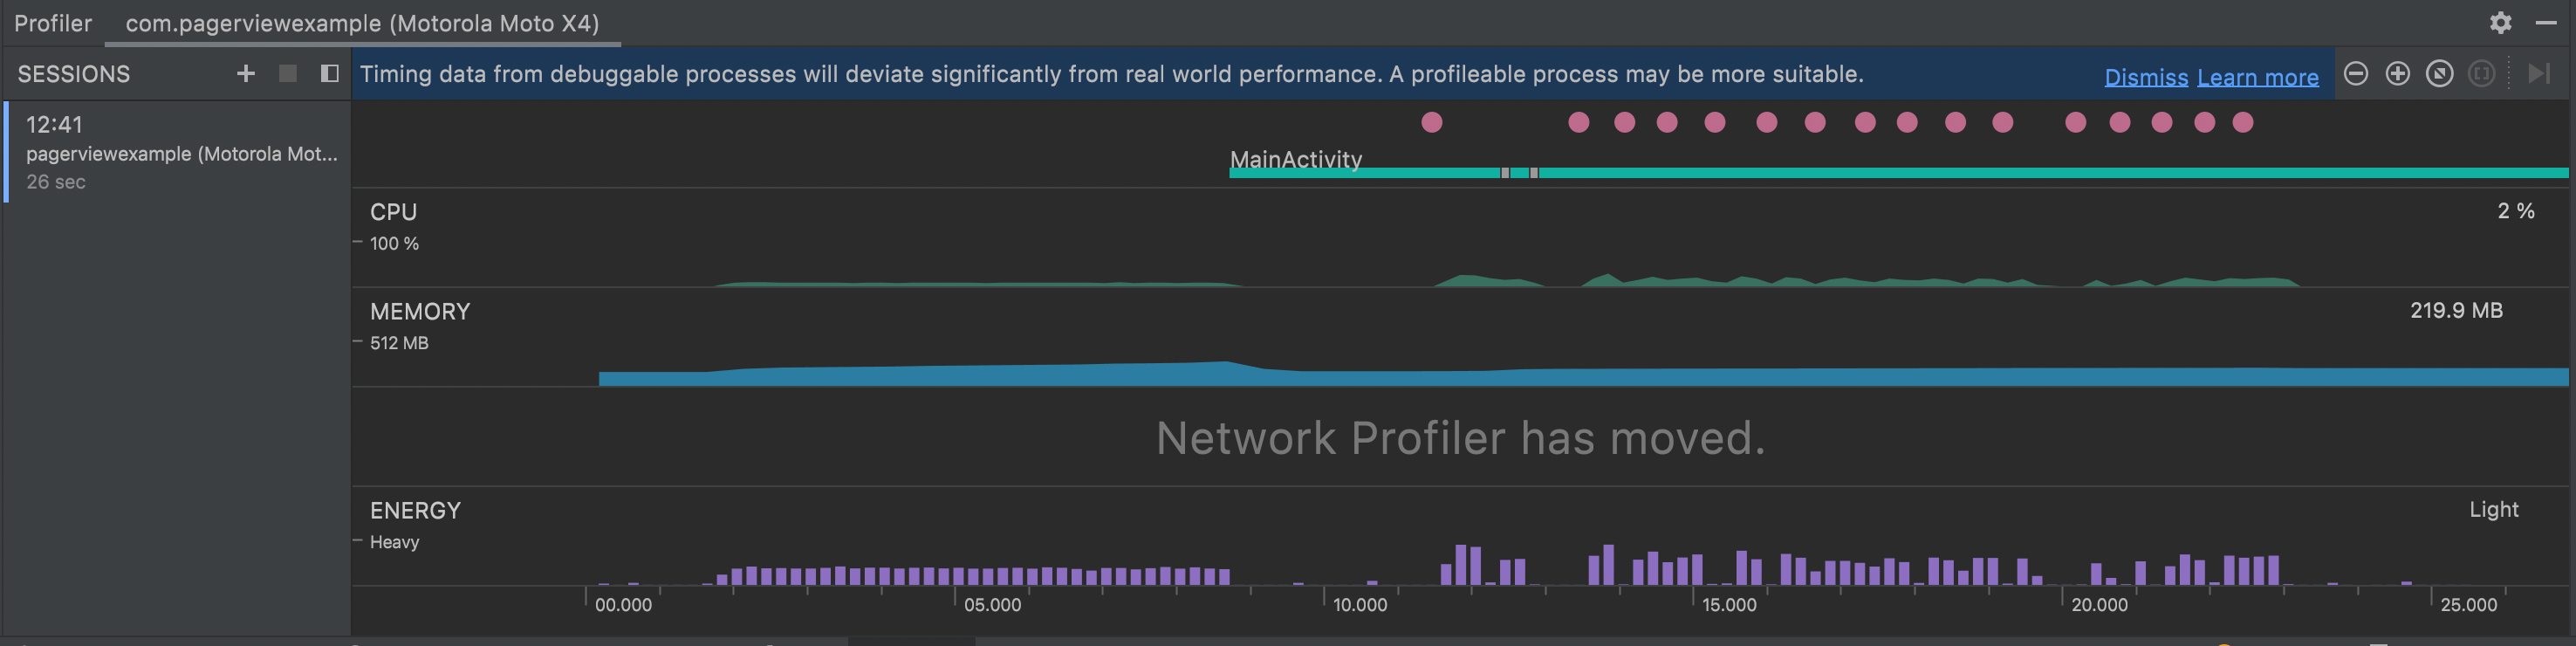
Each greenfield React Native app has only one Android Activity. If your app has more than one, it’s most likely a brownfield one. In the above example, we don’t see anything interesting. Everything works fine without any glitches. Let’s check each metric:
- The CPU metric is strictly correlated to energy consumption because the CPU needs more energy to do some computations.
- The memory metric is not changing while using the app, which is expected. Memory usage can grow, e.g. when opening new screens, and drop when the garbage collector (GC) releases free memory, e.g. when navigating out of a screen. When memory increases unexpectedly and keeps on growing, it may indicate a memory leak, which we want to avoid, as it can crash the app with out-of-memory (OOM) errors.
- The network section has been moved to a separate tool called the Network Tab. In most cases, this metric is not needed because it is mostly related to the backend infrastructure. Here's more about profiling a network connection.
- The energy section gives hints on when our app’s energy usage is low, medium, or high, impacting the daily experience of using the app.
Use Android Profiler in action
In the previous example, we could see some relations between each metric:
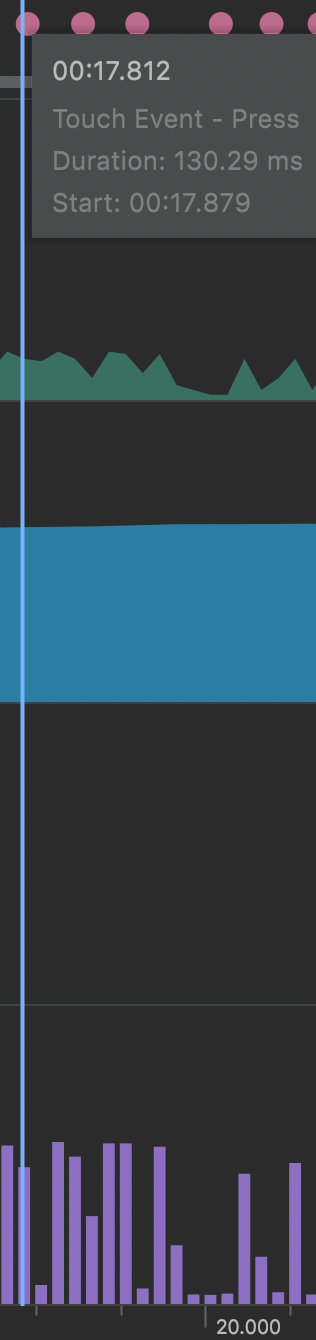
To see a more detailed view, we have to double-click on the tab. Now we can see more details. When the user started to do some touch action (swiping in the above example), we could see more CPU work. Each app will have its own signature of CPU spikes and lows. It’s important to build an intuition about it, by interacting with it and pairing certain activities, like touch events, with the increased usage. In other words, some spikes are expected, because the work needs to be done. The problem starts when CPU usage is very high for extended periods or in unexpected places.
Let’s imagine you would like to pick the best list or scroll view component for your React Native app, which has the best performance on a lower-end device. You noticed the current solutions could be revamped or improved and you started working on this. In your experiment, you would like to check how your solution works for LE devices using the above-described solution. When you double-clicked on CPU, you could spot the below data:
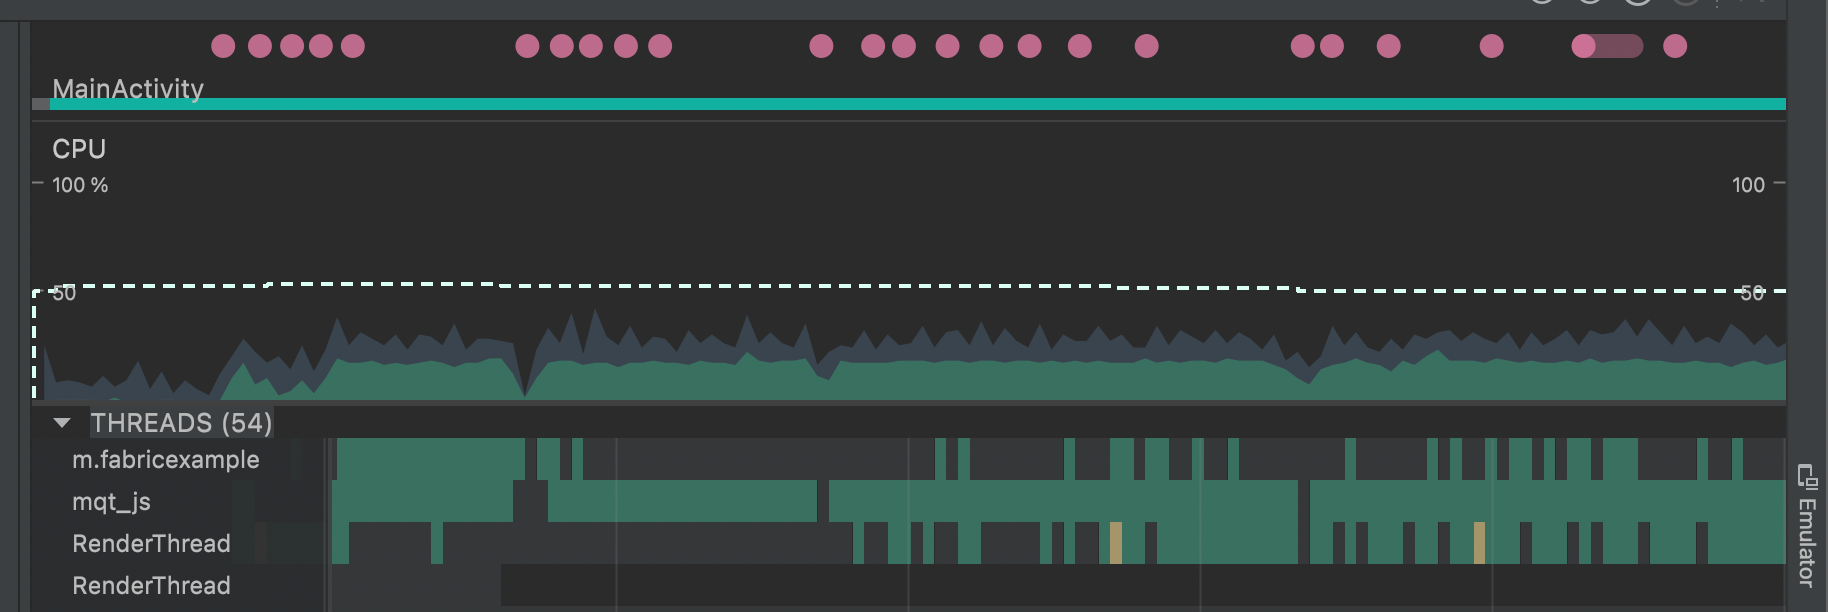
Here you can see the mqt_js thread is used almost all the time and does some heavy computation because your computations are done on the JS side. You can start thinking about how to improve it. There are multiple options to check:
- Replace the bridge with JSI in terms of communication – do tests if JSI is faster than the bridge.
- Move some part of the code to the native side – on the native side you have more control over threads execution and can schedule some work to not block the JS or UI thread.
- Use a different native component – replace the native scroll view with your custom solution.
- Use shadow nodes – do some expensive calculations with C++ and pass it to the native side.
You can try out all of those solutions and compare the effects between each other. The profiler will provide you with a metric, and based on that, you can decide which approach fits your particular problem best.
There’s more info about the Android Profiler.
System Tracing with Android Studio CPU Profiler
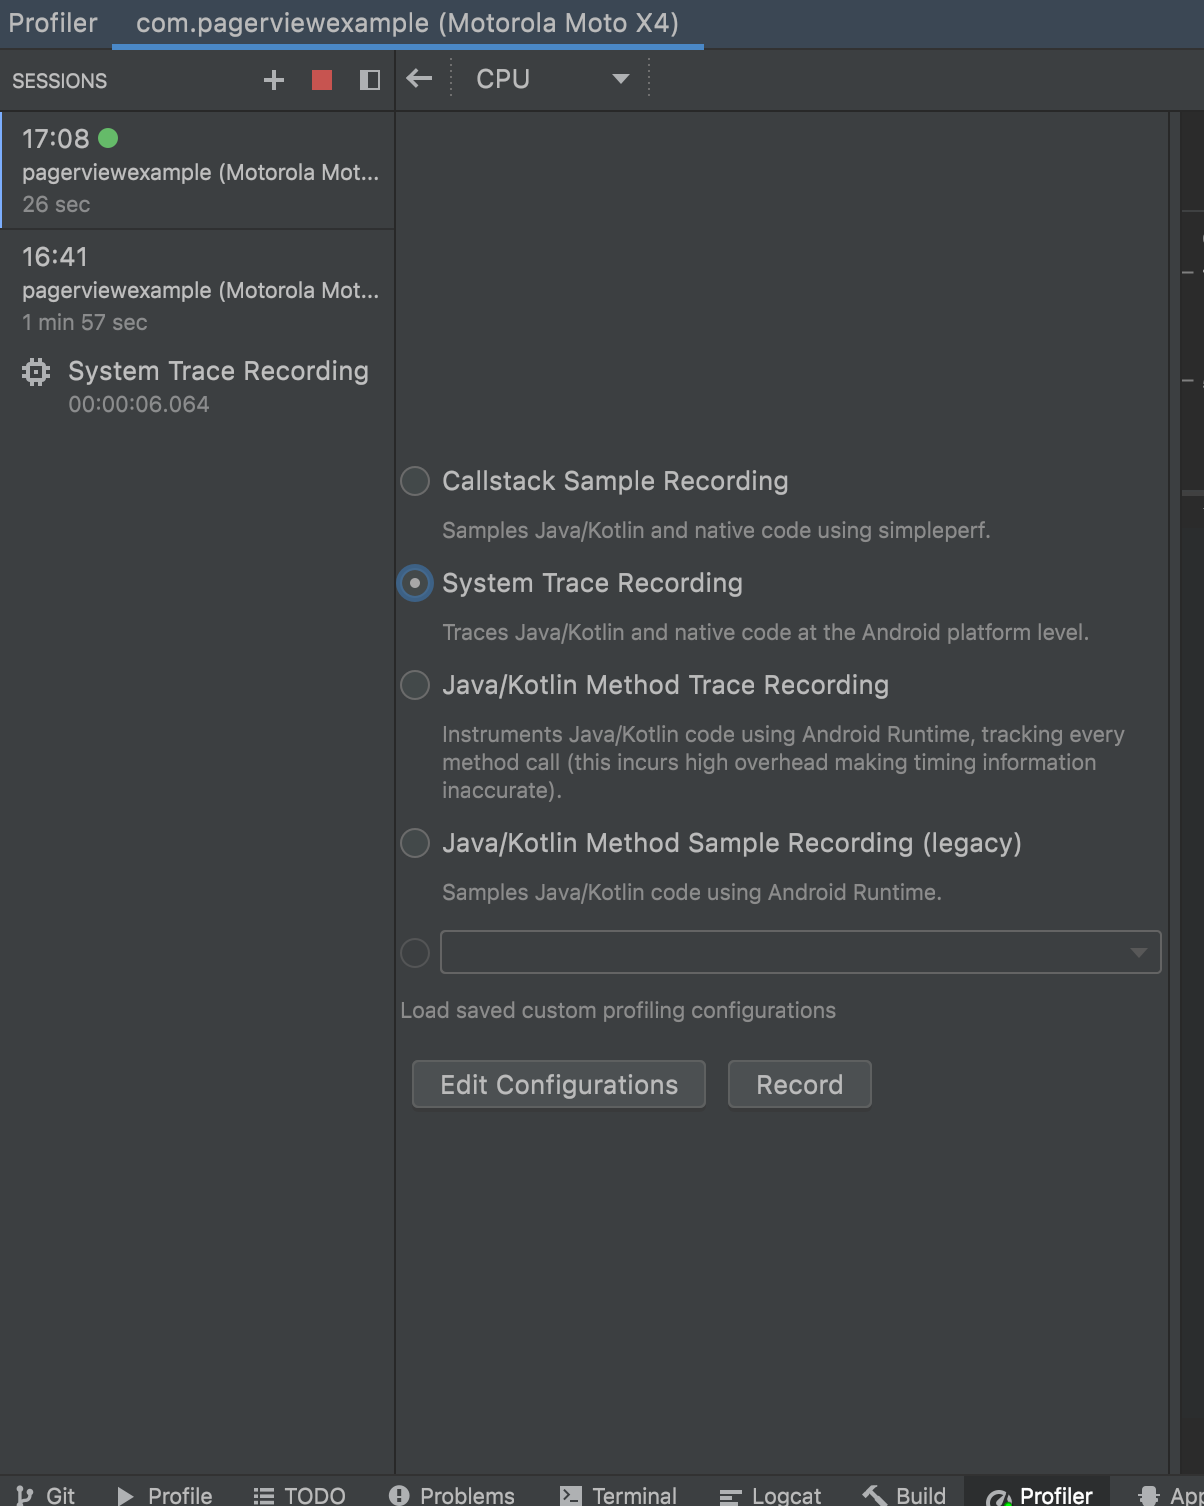
Using the Android Studio CPU Profiler, we can also make a system tracing. We can check when the appropriate function has been called. We can triage all threads and see which function is the costliest which affects the UX. To enable system tracing, click on the CPU section and select System Trace Recording.
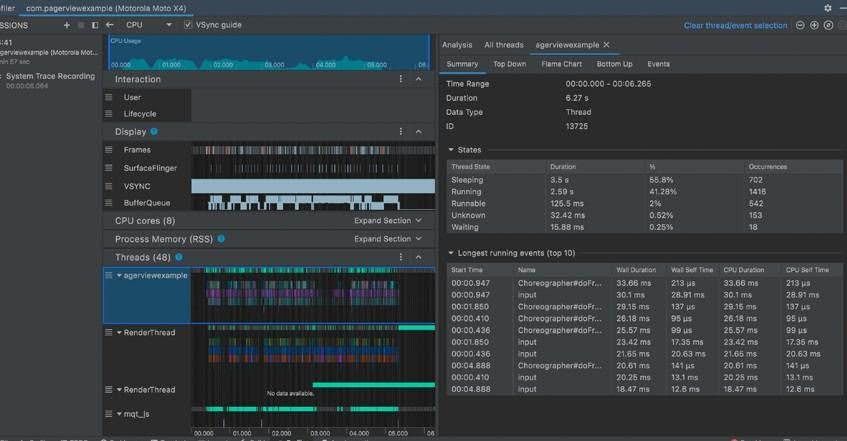
After some interaction, you should be able to see all the threads with details:
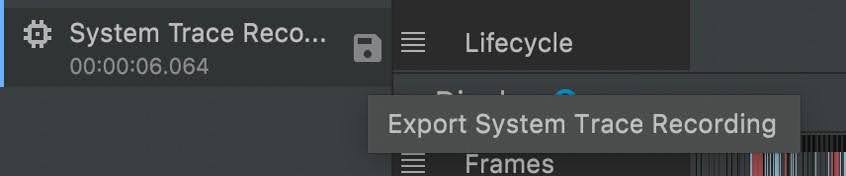
You can also save your data by clicking the Save Button:
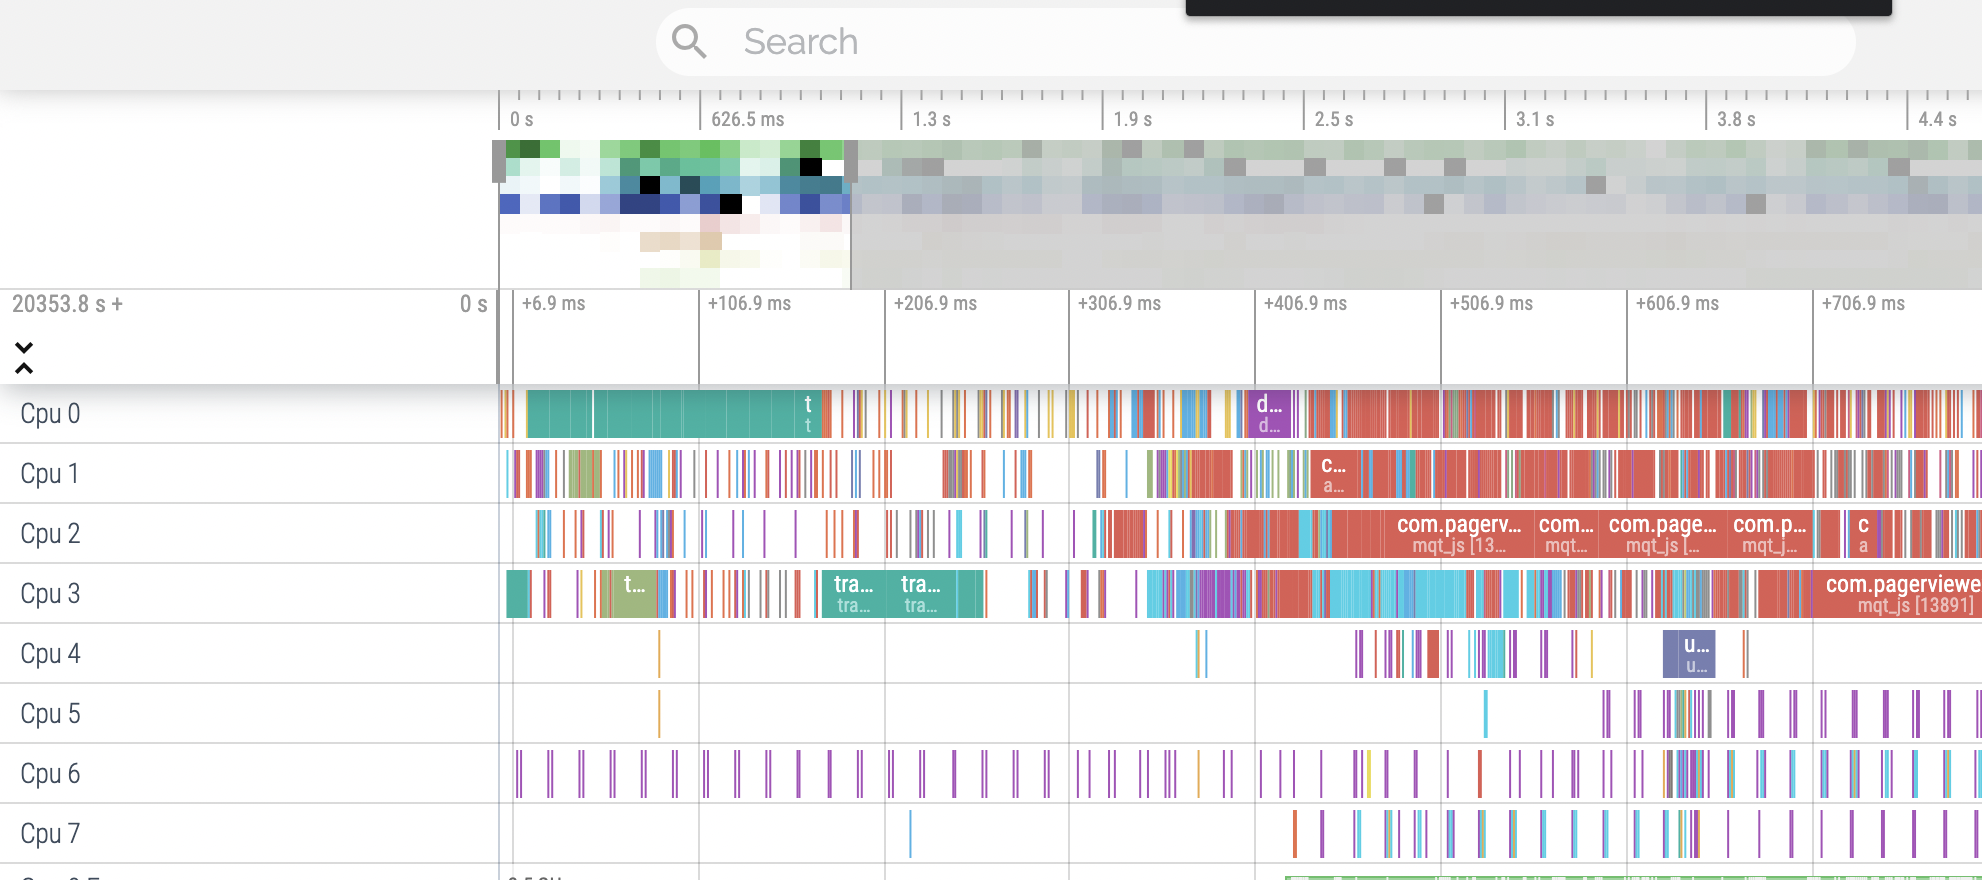
And use the data in a different tool, e.g. Perfetto:
You’ll also want to check the official Android Profiling guide by the React Native core team. They use different tools, but the outcome will be the same. The guide provides case studies and how to spot an issue on different threads:
- UI thread
- JS thread
- Native module thread
- Render Thread (only Android)
Flipper performance plugin for Android
We already know Flipper can be quite handy in hunting performance issues. One of the most interesting plugins to help us out on Android is android-performance-profiler. It can be used as a standalone tool or on a CI. It can generate beautiful reports, so this tool can be used to do some sophisticated experiments.
Here is a picture of an example experiment:
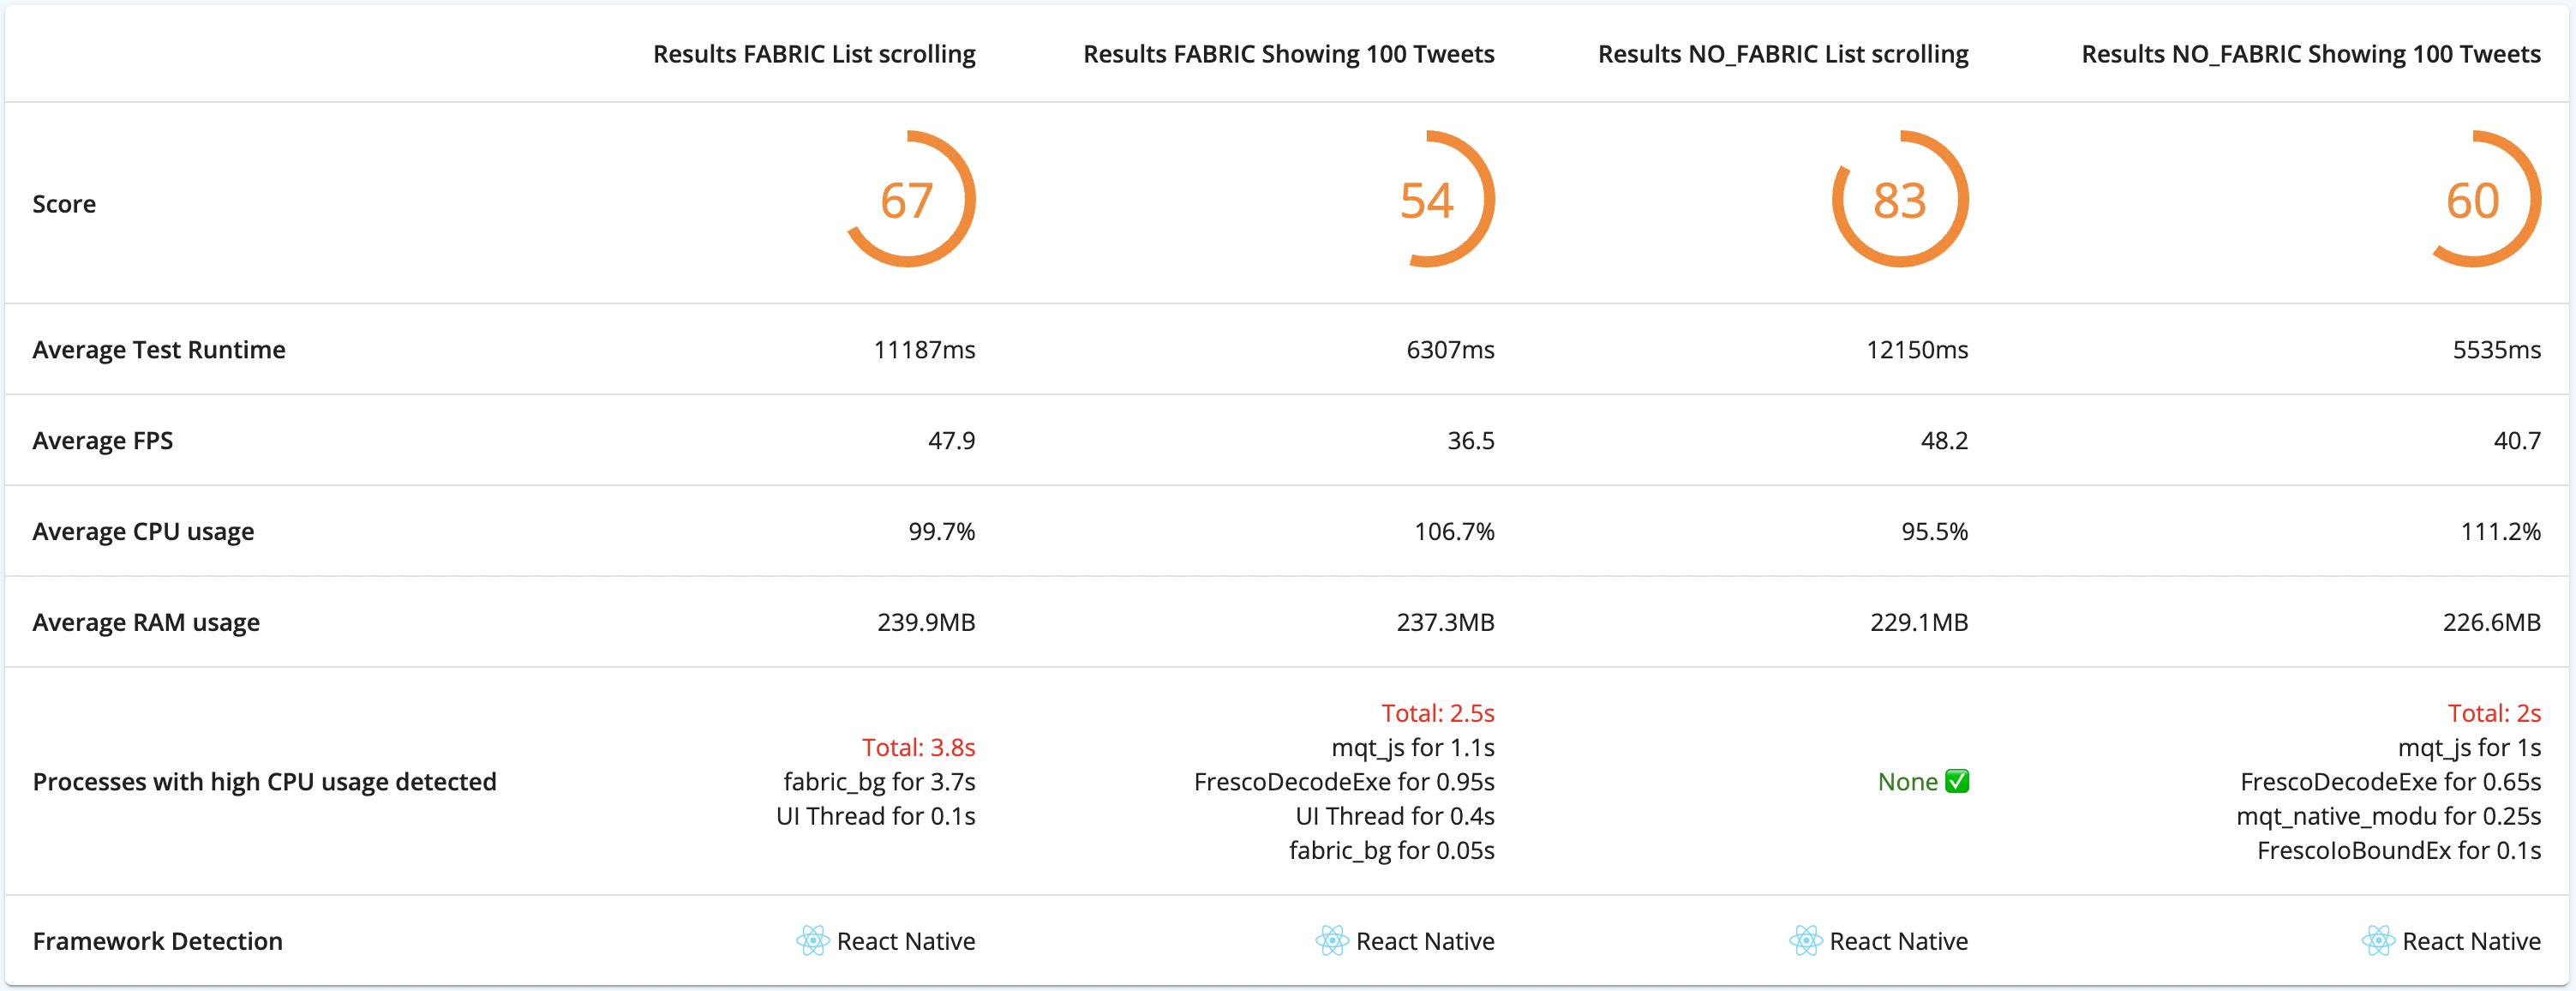
You can also automate your experiments with e2e tests and generate reports locally or on a CI. Those reports can be used to compare solutions with each other.
Profiling improves your app's responsiveness
70% of the users will leave your app if the response to a given action takes too long. And once they do, they aren’t likely to return ever again, which can seriously harm your business. For that reason alone, profiling your React Native application with native tools for iOS and Android may turn out a game changer – for both your organization and your user base.
In this article, we’ve shown how to profile your app with tools like Instruments, Flipper, and Hermes Debugger for iOS, and Android Profiler and Flipper for Android. If you need help with tracking down and solving your performance issues, drop our React Native development company a line – our senior devs will surely know how to help.


Learn more about Performance
Here's everything we published recently on this topic.