For years, web developers have enjoyed the luxury of profiling React components in near-production environments using "profiling builds." On the mobile side, however, React Native developers were largely left in the dark. Until now.
Thanks to our new library, @callstack/inspector, that gap is finally closed.
With Inspector you can now profile your React components directly within a release build with profiling functionality. This way you can get a better overview of your app’s performance the way your users experience it, without the development-only debug code that slows down JavaScript execution considerably.
Let’s walk through how to set this up step-by-step using an Expo application.
Getting Started
First, let’s bootstrap a fresh Expo application using SDK 55. We will name this project my-expo-app:
npx create-expo-app@latest --template default@sdk-55Installation
Next, we need to install the inspector package alongside a required development dependency for Metro:
npm i @callstack/inspector
npm install --dev @react-native/[email protected]
Configuration
1. Update Metro Configuration
Because the default Expo template doesn't ship with a metro.config.js file, we need to generate one first. Execute the following command:
npx expo customize metro.config.jsNow, open your newly created metro.config.js and wrap your configuration with withInspector:
const { getDefaultConfig } = require('expo/metro-config');
+const { withInspector } = require('@callstack/inspector/metro');

const config = getDefaultConfig(__dirname)

+module.exports = withInspector(config, true);
2. Create a Custom Entry Point
We need to import the inspector at the absolute top level of the application. To do this, create an entry.tsx file in your root directory:
// Register the inspector at the very top 👇
import "@callstack/inspector";
import { ExpoRoot } from "expo-router";
import { AppRegistry } from "react-native";

function App() {
  const ctx = require.context("./src/app");
  return <ExpoRoot context={ctx} />;
}

AppRegistry.registerComponent("main", () => App);
Next, point your package.json to this new entry file instead of the default Expo Router entry:
{
  "name": "my-expo-app",
  "main": "./entry.tsx",
  "version": "1.0.0"
}
Running and Profiling
With the configuration out of the way, spin up the new inspector command in your terminal:
npx inspector startYour terminal output should look like this:
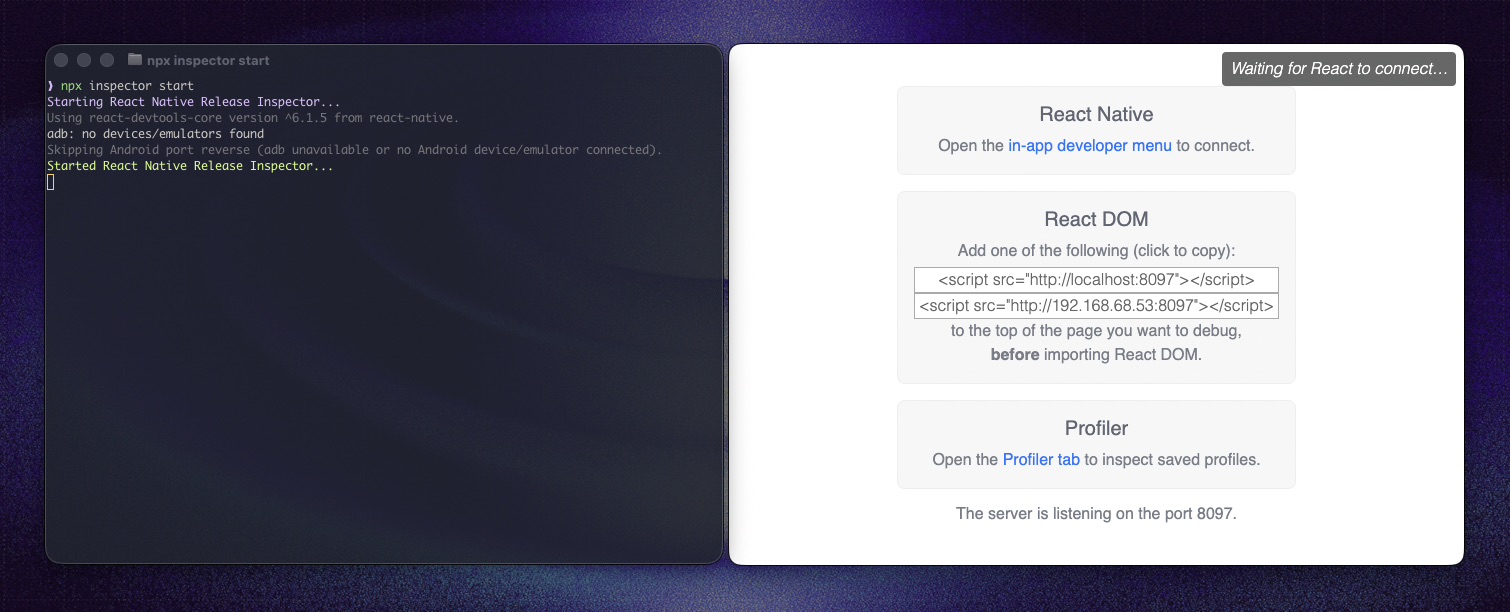
Because Expo Go does not support release builds, you will need to run a local native prebuild using the release configuration to test this out.
npx expo run:ios --configuration ReleaseFor Android, No extra configuration tweaks are required. Simply run your application with the release variant, start the inspector once the emulator launches, and begin profiling🚀
Once your app builds and launches, you are ready to start profiling and analyzing your runtime performance!
Final Words
Profiling production-ready builds gives you the ground truth about your app's performance the same way your users experience it, allowing you to make high-impact optimization decisions with confidence. Because @callstack/inspector requires zero native code changes, integrating it into your workflow is incredibly friction-free.
Cherry on the top is that you can also leverage React.Profiler to collect performance metrics via the onRender callback during release builds and handle that data however you see fit—whether that's logging it locally or upstreaming it to an analytics service.
Want to try it on a bare React Native application? It takes just three simple steps. Head over to the official @callstack/inspector repository to check out the documentation, and don't forget to leave a star! ✨

Learn more about Performance
Here's everything we published recently on this topic.