Jakub is a well-known React Native performance optimization enthusiast. Edu co-authored chapters on profiling in our Ultimate Guide to React Native Optimization. They’re a match made in heaven if you want to record a comprehensive episode on profiling.
Tools, metrics, and workflow
Next, our experts discuss tools and metrics worth tracking, for example, CPU or memory usage. They mention tools you can use to profile Android and iOS.
To end the discussion with an actionable item, in the last part of the episode, they talk extensively about the workflow you can follow. Tune in and enjoy the episode!
Learn more about Performance
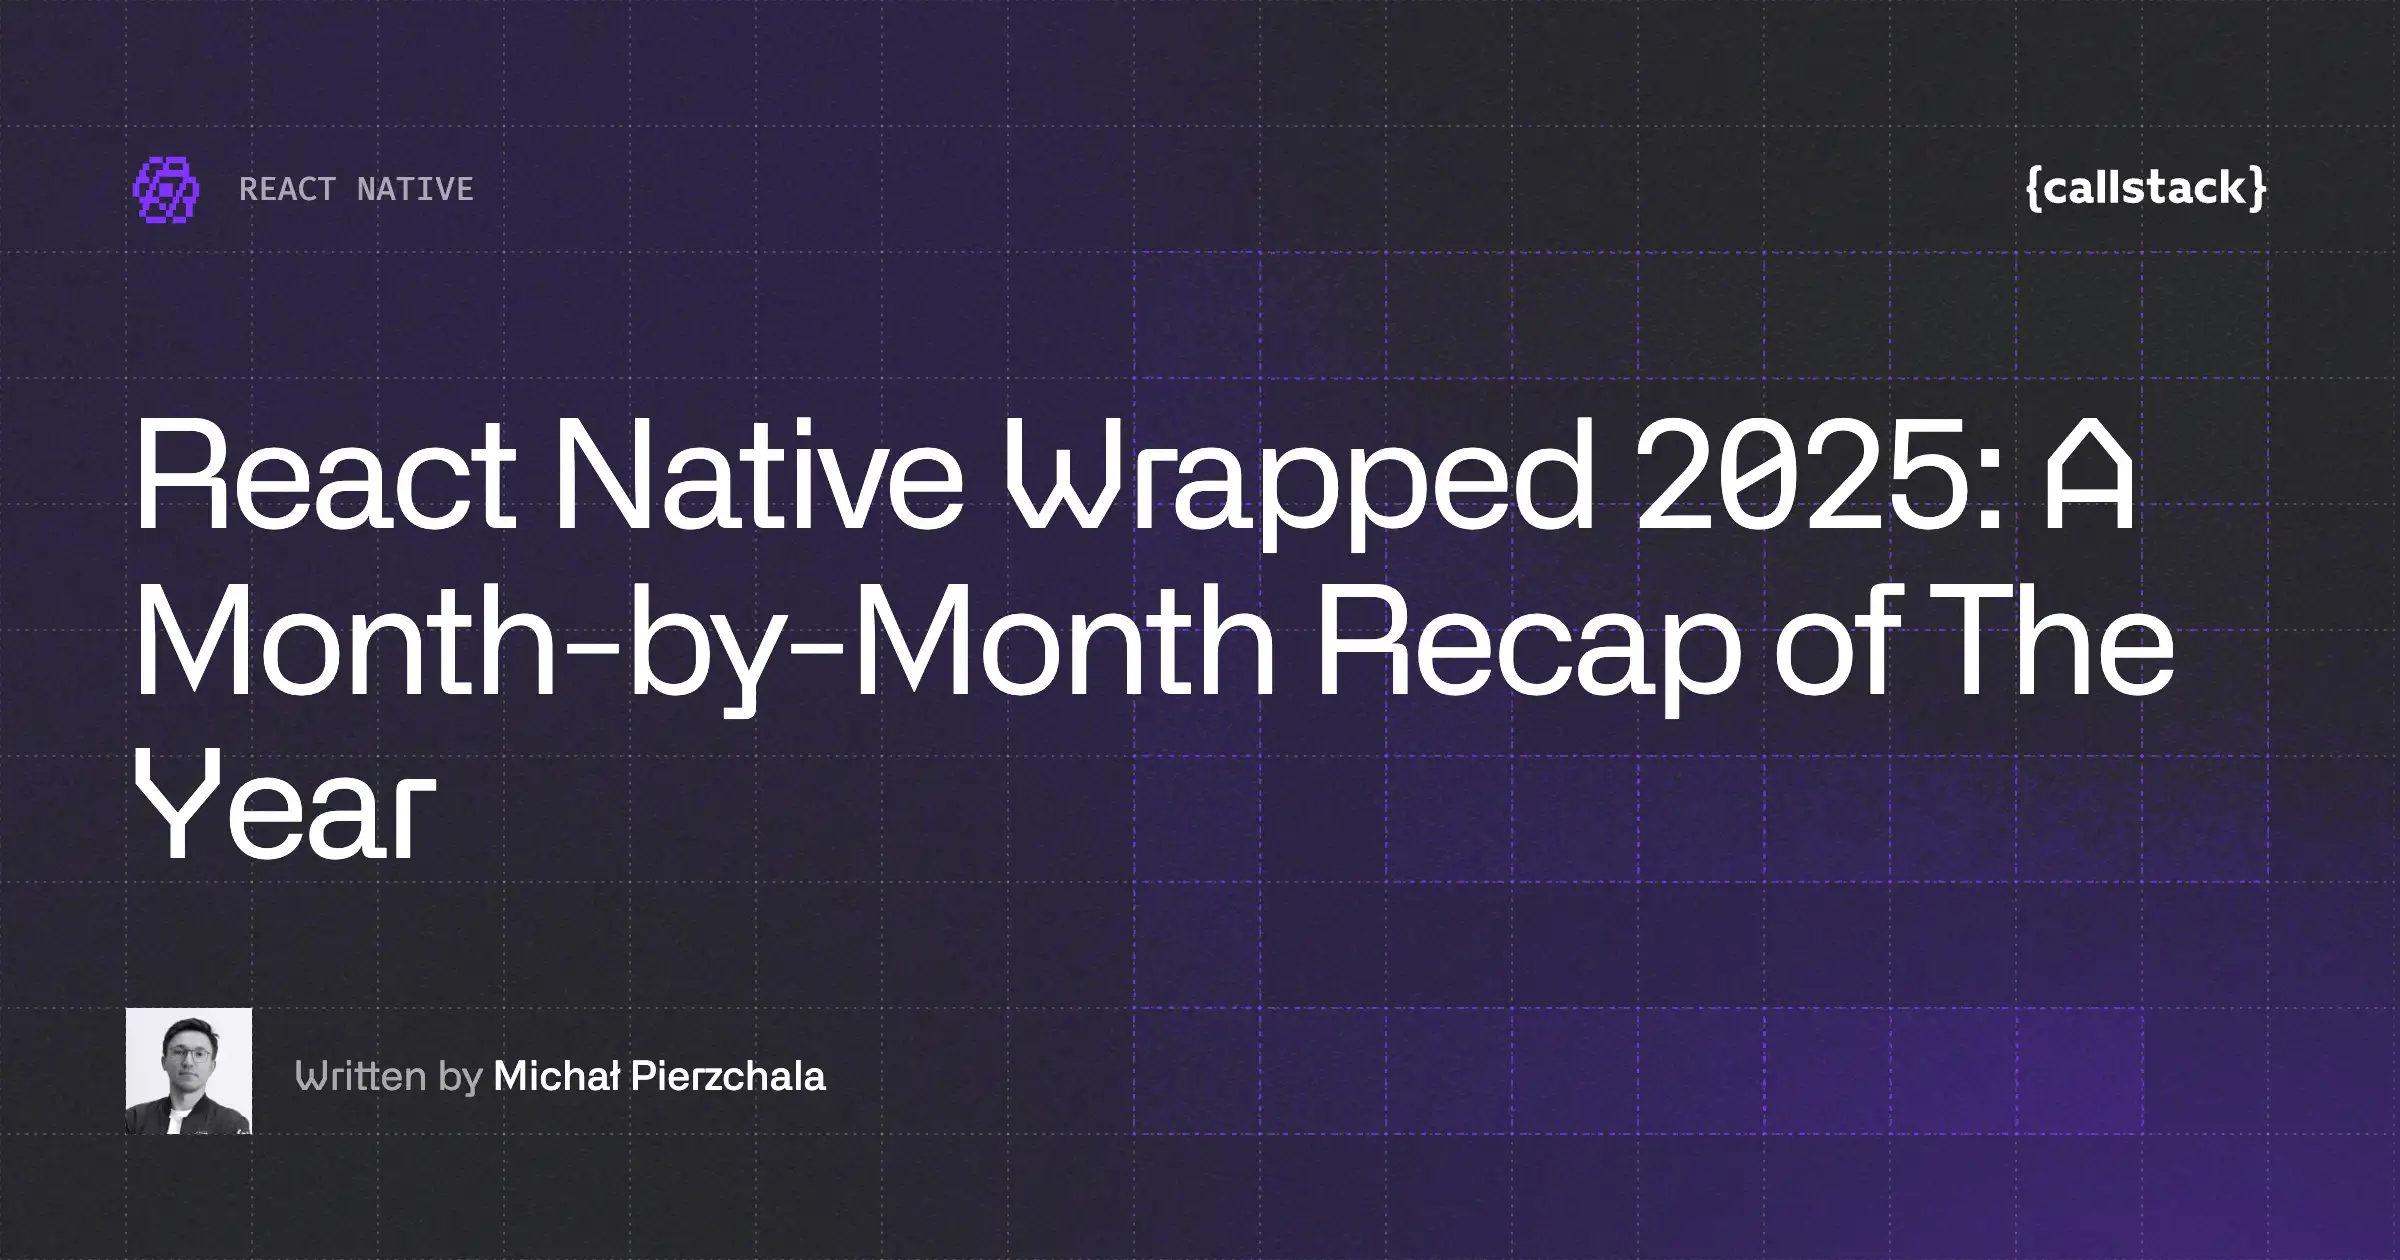
React Native Wrapped 2025: A Month-by-Month Recap of The Year
The first edition of React Native Wrapped looks back at the year RN turned 10 and the ecosystem doubled down on the New Architecture. It provides a month-by-month record of 2025, covering major framework releases, the Legacy Architecture freeze, React 19 integration, and notable developments across tooling, performance, styling, native modules, Expo, and platform adoption.
The Missing QA Loop for Mobile Agents
Lorem ipsum dolor sit amet, consectetur adipiscing elit. Suspendisse varius enim in eros elementum tristique. Duis cursus, mi quis viverra ornare, eros dolor interdum nulla, ut commodo diam libero vitae erat. Aenean faucibus nibh et justo cursus id rutrum lorem imperdiet. Nunc ut sem vitae risus tristique posuere.
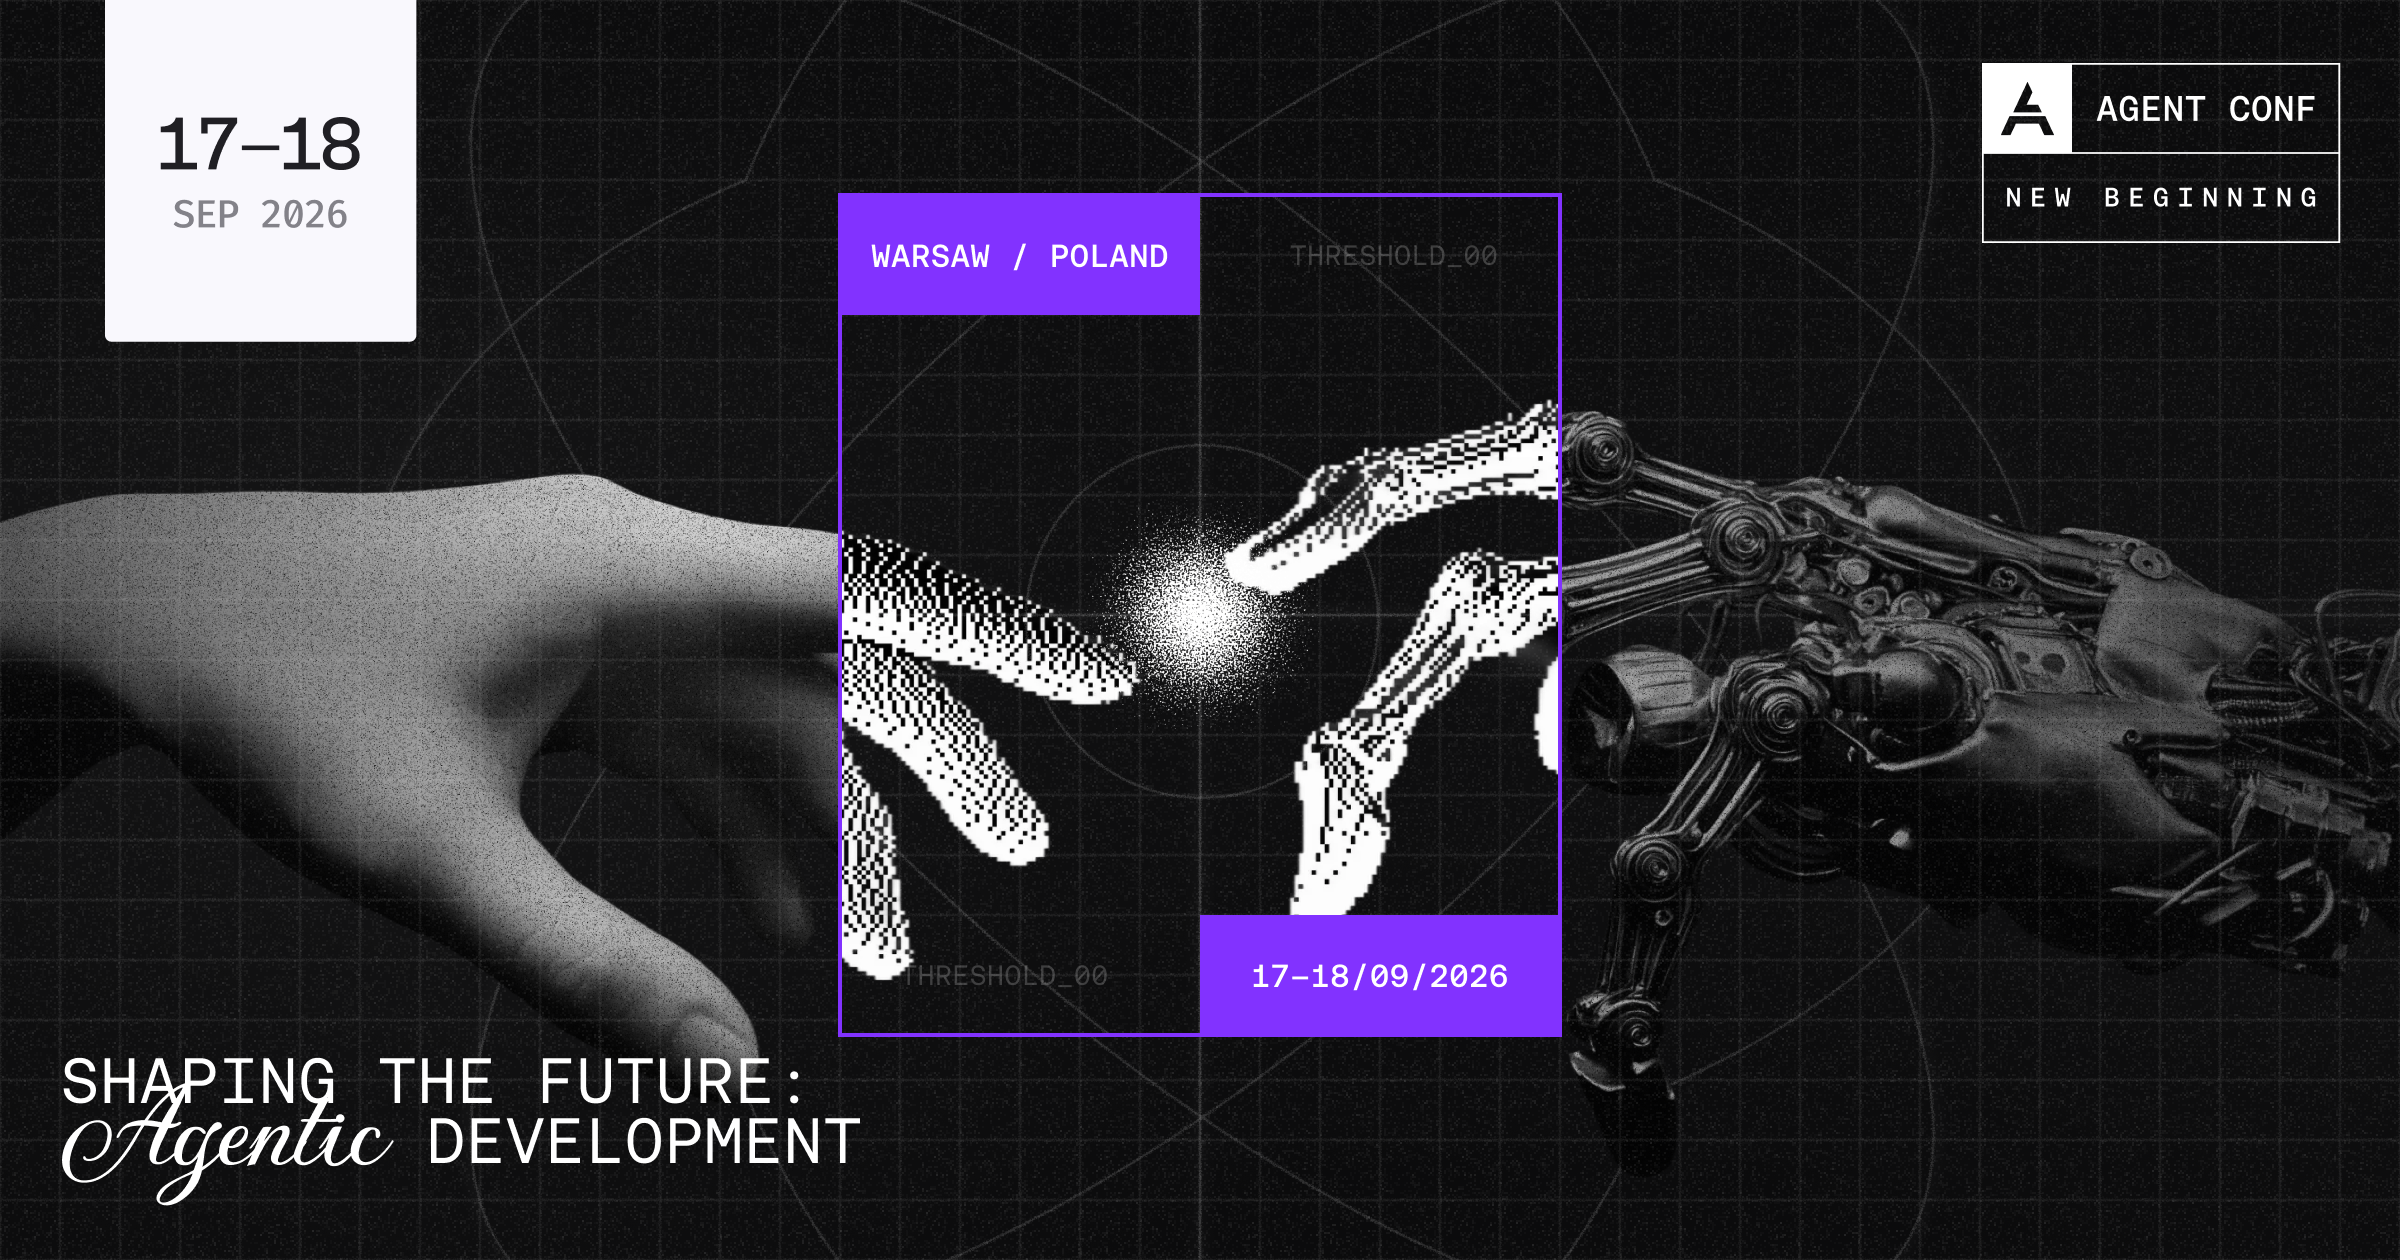
Agent Conf
Lorem ipsum dolor sit amet, consectetur adipiscing elit. Suspendisse varius enim in eros elementum tristique. Duis cursus, mi quis viverra ornare, eros dolor interdum nulla, ut commodo diam libero vitae erat. Aenean faucibus nibh et justo cursus id rutrum lorem imperdiet. Nunc ut sem vitae risus tristique posuere.
From Native to React Native for TV: The Zattoo Case
Lorem ipsum dolor sit amet, consectetur adipiscing elit. Suspendisse varius enim in eros elementum tristique. Duis cursus, mi quis viverra ornare, eros dolor interdum nulla, ut commodo diam libero vitae erat. Aenean faucibus nibh et justo cursus id rutrum lorem imperdiet. Nunc ut sem vitae risus tristique posuere.