Every bit of native code we use in our apps has a runtime cost associated with reading, loading, and executing said code. The more native dependencies our apps have, the slower it is for apps to start, which impacts the TTI (Time to Interactive) metric, which in turn frustrates your users who wait longer to start enjoying your app.
In React Native apps, we often rely on dependencies that load Kotlin, Java, Swift, Objective-C, JavaScript, and recently more often, even C++. Those dependencies are declared in the package.json file, which allows for a JavaScript bundler to correctly discover and, well, bundle their JS parts into the final application. It may be counterintuitive at first, but this declaration in the JavaScripttoolchain influences the native side as well. And the reason for that is the “autolinking” feature of the React Native CLI.
Autolinking in React Native
Autolinking allows us to link native dependencies in our React Native apps automatically, without ever touching native tooling like Cocoapods, CMake, and Gradle, and just enjoy using the resulting functionality with JavaScript. If you’re not familiar with how the Android or iOS toolchains work in terms of using community packages, you might be asking, “What in my app would be linking native dependencies?”
While there are some React Native community packages that are pure JavaScript, many require compiling native code – sometimes different native code per platform – to convey that functionality to your application’s JavaScript. When dealing with native binaries, be it either in C++, Objective-C, or Swift, linking is a way for the native toolchain to understand where to find the actual code that’s associated with the third-party dependency we want our app to use.
What’s important is that it’s necessary, and for a long time, we, React Native developers, needed to do this step manually. Since React Native 0.60, we have an automated way of doing this thanks to the React Native CLI.
Understanding the Performance Impact of Autolinking
One important thing to know about autolinking is that it crawls your package.json and then node_modules in search of native code. The tool doesn’t know whether you’re actively using the library that ships native code or not. It will be linked anyway. How does that impact your application’s performance?
All the native dependencies discovered by autolinking will be linked and available in our app bundle. As a result, we’ll end up with an increased application binary size (separate from, and in addition to, the JS bundle size) and likely worse TTI, as the mobile OS will spend more time loading the native binaries, showing your users a splash screen a bit longer.
Find and remove unused dependencies
We can use the depcheck tool to find the unused dependencies in our project. It is very effective for analyzing the project’s dependencies to see how each one of them is used, which dependencies are superfluous, and which dependencies are missing from package.json. To use depcheck, we need to run npx depcheck in the root of our project. An example of the results looks like this:
.png)
Dev dependencies likely won’t end up in the JS bundle but could still link native code into your production app if they have native code in their implementation. In this example, the dev Dependencies listed are JS-only, so there is no need to focus on them.
The results show us that we have a few unused dependencies – and what’s more important, in this example, these dependencies are relying on some native code. Now we have to remove them, and it’s done! In the example app, removing unused dependencies from the screenshot above occurred with the following reduction in the application size:
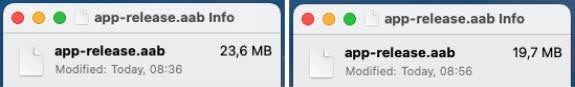
Possibly even more than reducing the application size, there was a noticeable improvement in the Time to Interactive on the tested Android device, which was reduced by 17% in this case.
Measure the TTI in your app
How can you measure the TTI in your application? There are a few ways to do it. Whichever you choose, remember to always measure on a release version of the app when dealing with absolute numbers.
One way is to use a stopwatch and measure the time the app takes to show the first screen. It’s entirely manual, but it will often do the job for one-off measurements.
Another manual way is to use a recent phone with a high-frame-rate camera (e.g. 120fps), and record a video of your app launch on a real device. You can then load the video, zooming into the timeline to the exact time offsets between tapping your app icon and when the first meaningful render happens.
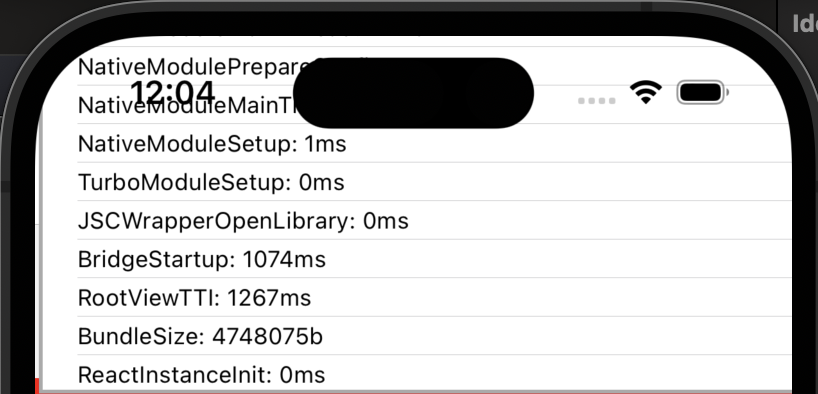
We have used this data-driven method to accurately and repeatedly observe improvements as small as 50ms, which may sound small but can often be the difference between an adequate experience for the user versus a magical one. If we want to get a more detailed output, we can make use of Perfetto for Android. For iOS, we can enable Perf Monitor from DevMenu and double-tap on the monitor window to expand. The output will look like this:
We can also use App launch from Xcode instruments, but you should note that this is not the same as the end-user experience on their device. You should always double-check your production application build on a retail device as to as possible to what your users have. All you need is to install a release build through profiling to your real device. Then select App Launch from the window that will appear automatically once the build is installed. Hit the record button, and once the app has launched, stop recording. You will get an output similar to this:
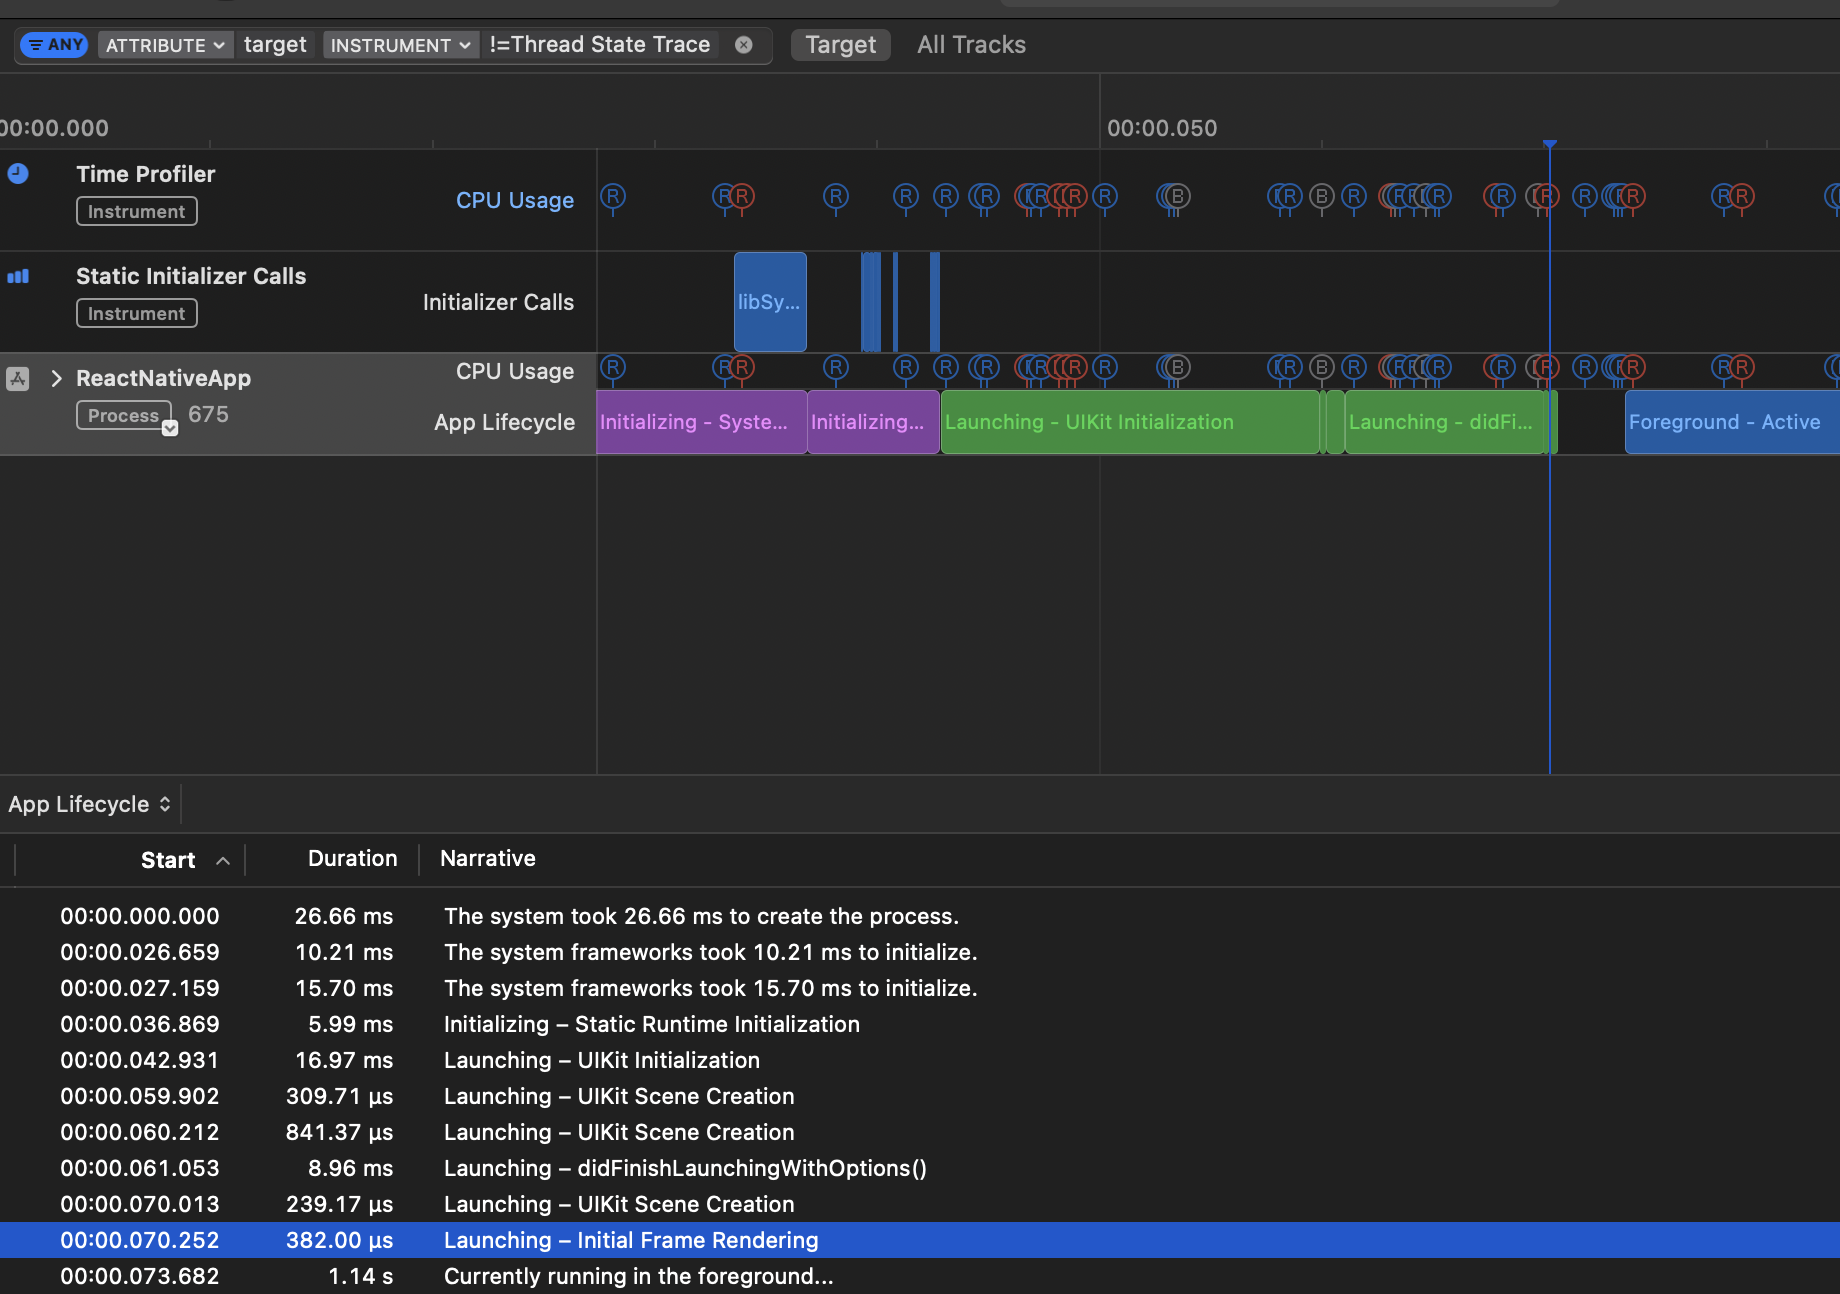
App launch time
There are two phases when calculating app launch time on iOS. The first one is called pre-main time, and it’s the time before the main function of the app is executed. It’s marked with the purple area on the graph above – all the work needed to launch the app correctly, like initialization and the linking of libraries, happens in this phase.
The second phase, called post-main-time, is the time between executing the app’s main function and presenting the first interactable view to the user. It’s marked with the green color on the graph above. The total app launch time is the sum of both of these metrics. If you want to learn more, here’s a good read on testing app launch time.
It’s worth mentioning that there are lots of third-party tools helping developers gain a bunch of performance information from apps already submitted to Google Play and App Store. The most popular are Firebase Performance Monitoring, Sentry, and DataDog. The key advantage of using one of these tools is gaining data about performance from the myriad of different devices used by your actual users.
Enjoy a smaller bundle size and faster time to interactive
Removing a few unused native dependencies ended up reducing both the size of the app bundle and TTI by around 17%. Providing only resources needed by the app can improve the Time to Interactive metric, making users less likely to uninstall your app from their devices due to excessive load time.
It’s worth remembering that although autolinking is a great and powerful feature, it can be overzealous when it comes to linking code our app doesn’t really use. Make sure to keep your dependencies up to date and clean up unused ones during refactorings.


Learn more about Performance
Here's everything we published recently on this topic.