This post is a deep dive into a performance issue of the MLC-LLM engine that we encountered on some Android devices. Callstack’s library, the @react-native-ai/mlc package, wraps the MLC-LLM engine, bringing it into the world of React Native.
While testing it on Android devices, we ran into an interesting challenge. Here’s a deep dive into it and how we fixed it. Expect lots of low-level code tinkering to profile the internals of the underlying libraries. 🔧 The performance investigation we describe in this post allowed us to track down the issue that was reproducible on Android devices equipped with a specific GPU series. We will start with an introduction to what this library is, why it matters, what (and most importantly, how!) we were able to narrow down as the location of the problem, and finally how we were able to resolve this issue in our library.
Introduction to MLC-LLM
MLC-LLM is a machine learning compiler & at the same time LLM inference engine supporting multiple platforms (Linux, Windows, macOS, web, iOS / iPadOS, Android) with hardware acceleration. It works by optimizing & compiling models you provide to a format of its underlying MLCEngine, and by running inference on your device using the optimal backend your device supports. We chose this library largely due to these 2 factors: wide platform & hardware compatibility, and performance optimizations.
The MLC-LLM’s workflow for consuming a model can be summarized as follows:
- Model import: MLC-LLM supports both importing a pre-quantized model, as well as quantizing an original model; quantization is the process of (lossy) compressing its original weights to a smaller representation format for reducing computational & memory costs of the model, e.g. converting from FP32 (32-bit floating-point) to FP8 (8-bit floating-point), U8 (8-bit unsigned integer) or U4 (4-bit unsigned integer).
- Compilation: A model optimization that uses mathematical, computational or device capability tricks (memory planning, operator fusing, operations accelerated for specific hardware, library offloading - leveraging available high-performance libraries such as CUDA, cuBLAS or FlashInfer).
- Inference: Using the platform-native MLC-LLM runtime; for instance, in the case of
@react-native-ai/mlc, this is either MLC JVM (for Android), or MLC Swift (for iOS); for each runtime, there is a variety of supported backends that can be leveraged to achieve accelerated computations, such as OpenCL, Vulkan, CUDA, or ROCm. In our case, to support most Android devices, the runtime has been built with OpenCL support and allows, for example, running accelerated calculations on the GPU devices equipped with an Adreno or Mali chip.
The performance aspect
Now, there are various metrics you may consider when deploying a model in your product.
From an end user’s point of view, in the case of LLMs, the following factors need to be taken into account:
- Number of parameters, which scale its capabilities.
- Model size: A constraint for a typical user, since disk space is limited.
- Model throughput: The number of tokens per second the model can process.
This has a direct impact on the user: the smaller this value is, the longer the user will “wait for the LLM to respond”.
The metric can even be split into input (in MLC’s codebase, it’s called ‘prompt’ tokens) and output tokens (in MLC, this is ‘completion’ tokens), each measuring the speed at which — appropriately — the input is tokenized, tokens are embedded into a continuous space (i.e., converted to vectors of floats), and passed into the network (i.e., the attention and feedforward layers are executed with the embedded input).
We provide a wrapper around the MLC-LLM: @react-native-ai/mlc , which brings it to the React Native world. The library has a Vercel AI SDK-compatible API, allowing for a convenient integration with a well-known and widely compatible interface. It also allows you to receive the tokens per second metrics, accumulated to a total metric or split into input & output metrics.
But… why even care, which backend is used behind your inference engine? The reason is simple: variety. Each manufacturer has their preferred chip vendors and lines; in fact, the hardware can even sometimes vary between series or models of end devices. Each chip has different capabilities, instructions, and different support for computer drivers.
This means that if you choose an engine that has support for only one backend, or one that is not widely supported, it may even work very well on some devices but not work at all on others due to lack of support. The reason advanced backends are needed is optimization of calculations. A “simple” multiplication of matrices with dimensions m x n with n x p (quick maths revision: the internal dimensions must match for the multiplication operation to exist) can be realized naively with 3 for loops and has a time complexity of O(mnp). If you aren’t scared already, imagine you’re multiplying two same-size square matrices n x n, which would give you O(n3).
There are optimizations such as the Strassen algorithm for large matrices, or the slightly more optimized Winograd algorithm. There are also tricks that allow you to vectorize some of the operations performed on the CPU, such as SIMD instruction sets. Furthermore, you can extract some parts of your computation graph and run them in parallel threads. But for larger matrices, all this cannot match the power of GPUs, which allow you to parallelize those operations. Each set of operations that needs to be parallelized should be extracted to a sub-program called a kernel that runs on the GPU. While CPUs typically have around 4 to 32 cores, the GPUs usually have thousands. These numbers will be even smaller for mobile devices, especially low-end ones.
When it works, it works…
When it works fine, it works (brilliantly!) fine. We saw wonderful performance on both iOS and Android devices. However, there was one critical culprit: the first inference on Android would freeze the system UI for 20–50 seconds and trigger a 'Davey!' jank warning in the Logcat.” It was not just the case of an ANR (App Not Responding). The whole system UI would freeze. What was even more interesting was that this would only occur for the first inference, and any subsequent inference would run smoothly.
How to profile that?
So, where to even start looking for the culprit? The Logcat prints the “Davey!” message, indicating a large jank that something is happening on the GPU side. In conjunction with the fact that this only happened on the first inference, it cast suspicion on the initialization phase of the MLCEngine. This was the part where we needed to dive into its code to be able to profile anything.
Building MLC-LLM with profiling support
Where to start? The JavaScript world
We needed to profile the MLC-LLM’s procedures from the very beginning, starting from the moment it received our prompt (in the engine’s nomenclature, it would be a Request from that point forward). But first things first, let's start from this piece of code in our reproducer app:
const result = streamText({
  model: rnAIModel,
  prompt: selectedPrompt.text,
})
This in turn calls our NativeMLCEngineModule.kt ,TurboModule’s generateText method:
override fun generateText(
    messages: ReadableArray,
    options: ReadableMap?,
    promise: Promise
  ) {
    engineScope.launch {
      try {
        val messageList = parseMessages(messages)
        val responseFormat = // ...

				// >> the below is the part where we're entering MLC-LLM's code
        val chatResponse = engine.chat.completions.create(
          messages = messageList,
					// ...
        )

        // ...
Next station: Java & C++
The engine itself is part of the MLC JVM runtime, which is an instance of the Kotlin class [ai.mlc.mlcllm.MLCEngine], a facade instrumenting the mlc::llm::json_ffi::JSONFFIEngine, which is responsible for calling the native MLC Engine implemented in C++ over JNI (Java Native Interface). So, the right place to instrument for tracing is the C++ implementation.
Fortunately, MLC-LLM already contains a great implementation of trace recorder: mlc::llm::serve::EventTraceRecorder, which is a builder for Perfetto-compliant JSON trace reports. Its API is simple:
- register all events you are interested in using
void AddEvent(const String& request_id, const std::string& event)to register an event for a given (inference) request - when finished, gather the report using
std::string DumpJSON()and consume it
The only issue was that this implementation was not used in the production code (which is reasonable), and we needed to plug it in. The strategy was simple: instantiate the EventTraceRecorder, instrument output the JSON to a well-known location when the inference request is finished, and pull it using adb. For this reason, we needed to modify cpp/json_ffi/json_ffi_engine.cc:
#include "../serve/engine.h"
#include "../serve/event_trace_recorder.h"

this->engine_->InitThreadedEngine(device, std::move(request_stream_callback),
                                      std::move(EventTraceRecorder::Create()));
This addition is sufficient to enable the collection of diagnostic messages in the passed instance.Now, we need a way to dump the JSON file to disk. Since this is Android, we naturally need the proper permission (android.permission.WRITE_EXTERNAL_STORAGE). Then, we need a convenience method. We chose to implement it in mlc::llm::serve::ThreadedEngineImpl:
  void DumpJSON() {
#if ANDROID
    std::filesystem::path file_path = "/sdcard/Documents/mlc.json";
    auto report = this->trace_recorder_.value()->DumpJSON();
    LOGE("ThreadedEngineImpl::DumpJSON to %s", file_path.c_str());

    std::ofstream ofs(file_path);
    if (ofs.is_open()) {
      ofs << report;
    } else {
      LOGE("ERROR ERROR ERROR - Failed to open file for writing: %s", file_path.c_str());
    }
    ofs.close();
#endif
  }

  // ...

  // we need to add the symbol to the module's vtable
  TVM_MODULE_VTABLE_ENTRY("dump_json", &ThreadedEngineImpl::DumpJSON);
The above implementation is pretty primitive and has a hardcoded path, but it is a minimal version of what we need.
Instrumenting MLC-LLM C++ code
Now, we can instrument the code. The method we are interested in is Array<Request> mlc::llm::serve::NewRequestPrefillActionObj::Step(EngineState estate) inside new_request_prefill.cc, where we need to instrument every operation / block of operations we suspect may be causing the freeze with traces:
@@ -28,6 +28,7 @@ class NewRequestPrefillActionObj : public BatchPrefillBaseActionObj {
         model_workspaces_(std::move(model_workspaces)) {}

   Array<Request> Step(EngineState estate) final {
+    auto device_ = logit_processor_->getDevice();
     // - Find the requests in `waiting_queue` that can prefill in this step.
     std::vector<PrefillInput> prefill_inputs;
     {
@@ -123,6 +128,11 @@ class NewRequestPrefillActionObj : public BatchPrefillBaseActionObj {
           }
         }
         RECORD_EVENT(trace_recorder_, rsentry->request->id, "finish embedding");
+
+        RECORD_EVENT(trace_recorder_, request_ids, "start tvmsynchronize post-embedding");
+        TVMSynchronize(device_->device_type, device_->device_id,
+                       /*stream=*/nullptr);
+        RECORD_EVENT(trace_recorder_, request_ids, "finish tvmsynchronize post-embedding");
       }
       if (!cached_token_data.empty()) {
         embeddings = TokenData(cached_token_data)
@@ -147,6 +157,11 @@ class NewRequestPrefillActionObj : public BatchPrefillBaseActionObj {
       }
     }

+    RECORD_EVENT(trace_recorder_, request_ids, "start tvmsynchronize post-token data");
+    TVMSynchronize(device_->device_type, device_->device_id,
+                   /*stream=*/nullptr);
+    RECORD_EVENT(trace_recorder_, request_ids, "finish tvmsynchronize post-token data");
+
     // - Update logits.
     ICHECK(logits_for_sample.defined());
     Array<GenerationConfig> generation_cfg;
@@ -159,6 +174,11 @@ class NewRequestPrefillActionObj : public BatchPrefillBaseActionObj {
     }
     logits_for_sample = logits_for_sample.CreateView({num_rsentries, logits_for_sample->shape[2]},
                                                      logits_for_sample->dtype);
+
+    RECORD_EVENT(trace_recorder_, request_ids, "start tvmsynchronize post-update logits");
+    TVMSynchronize(device_->device_type, device_->device_id,
+                   /*stream=*/nullptr);
+    RECORD_EVENT(trace_recorder_, request_ids, "finish tvmsynchronize post-update logits");
     logit_processor_->InplaceUpdateLogits(logits_for_sample, generation_cfg, mstates_for_logitproc,
                                           request_ids);
Finally, we need to collect the traces.
This step can be performed at any point that is convenient for us. In this case, a good moment to do it is once the text generation is finished:
void Reload(String engine_config_json_str) {
@@ -256,6 +271,10 @@ class JSONFFIEngineImpl : public JSONFFIEngine, public ModuleNode {
         ChatCompletionStreamResponseChoice choice;
         Optional<String> finish_reason = delta_output->group_finish_reason[i];
         if (finish_reason.defined()) {
+          this->engine_->DumpJSON();
You may have noticed a few things in the code snippets above:
- I’m calling
RECORD_EVENTtwice: at the beginning and end of every traced block; also, the message starts withstart/finishon purpose. This is because theEventTraceRecorderImplimposes a convention: if the event does not start with either, it is an instant event, and otherwise it spans the time between start & finish, which is crucial for us. For reference, you can see the implementation here. - I’m calling
TVMSynchronizebetween every event recording to ensure all work of a previous recording is completed and not queued. As you may have notived, theRECORD_EVENTmacros don’t span the actual functions - just theTVMSynchronizecall… Interesting, isn’t it? That’s because the other operations complete very quickly, but don’t necessarily do the actual work. They only create and queue work for the GPU. However, this work may not be executed by TVM (the underlying compute framework) until the nearest synchronization.TVMSynchronizeflushes any queued work and blocks synchronously until the work is finished. - One tiny note for completeness:
logit_processor_->getDevice()actually does not exist. It needs to be defined for us to access the device identifier to performTVMSynchronize. Its declaration shall reside inlogit_processor.h, and the implementation is very simple:const DLDevice* getDevice() const { return &device_; }.
Viewing traces
The traces dumped to the JSON file are compatible with Perfetto, meaning the Perfetto UI can be used to view them interactively. Doing so would let us see the following:
.png)
For comparison, this is what it should look like (the below trace was recorded on the fixed version, to which we will get by the end of this post 😉):
.png)
As you can easily see, for the same model, the “working” version should take 0.5s to finish the prefill, yet it took us ~48s instead. The problem with this research was that there wasn’t much more that we could trace from this point. If it was an inefficient implementation or some over-large allocation, it would raise suspicion. However after the inspection, the code in this section looked perfectly fine.
At this stage, we filed a bug report , and got in touch with the maintainers. We wanted to express gratitude for their support, because they were extremely helpful in our investigation. Finally, we decided to take a deeper look into what’s happening on the GPU side.
Deeper dive: TVM & OpenCL
Adding OpenCL kernel tracing to TVM
For this particular case, our device was using an Adreno GPU, and the backend performing calculations was OpenCL. This is an open standard for parallel programming on heterogeneous systems that allows us to implement hardware-agnostic, efficient and parallel computations.
To achieve this, we needed to inspect the operations happening in MLC-LLM’s underlying compute engine, TVM. In 3rdparty/tvm/include/tvm/runtime/c_runtime_api.h, we needed to declare the symbol TVM_DLL int TVMWriteKernelProfilingReport(int device_type, int device_id, const char* path);. We implemented it as follows:
int TVMWriteKernelProfilingReport(int device_type, int device_id, const char* path) {
  API_BEGIN();
  DLDevice dev;
  dev.device_type = static_cast<DLDeviceType>(device_type);
  dev.device_id = device_id;
  DeviceAPIManager::Get(dev)->WriteKernelProfilingReport("/sdcard/Documents/tvm.txt");
  API_END();
}
This allows us to call this function at any moment to write the report to a well-known location, which we can later pull via adb. Since there are many backends and we only wanted to implement this for the needs of this research for OpenCL, the easiest approach was to do it in device_api.h as a virtual method: virtual void WriteKernelProfilingReport(std::string path) {};.
The WriteKernelProfilingReport would write a simple text file in our known format for manual parsing later. This file would contain all registered OpenCL kernel metrics (the sub-programs that in our case run on the GPU).
To collect the information about those kernels, we followed a simple idea.Whenever a wrapped function (piece of work) is called, the corresponding kernel to run it shall be tracked. Therefore, we added a basic approach consisting of two singleton maps to 3rdparty/tvm/src/runtime/registry.cc:
- mapping event queue IDs to kernel names — to be able to differentiate between them
- mapping event queue IDs to kernel start timestamps — to be able to position them on the timeline
The durations that the kernels would take would be provided by OpenCL itself. We’ll get to that shortly.
Next, we needed instrumentation to fill those maps inside void OpenCLWrappedFunc::operator()(TVMArgs args, TVMRetValue* rv, void** void_args).
Then, we hooked into opencl_device_api.cc - the implementation of the OpenCL backend - to retrieve kernel execution times via OpenCL’s clGetEventProfilingInfo function. The best moment to do this is after a TVMSynchronize call, which in the case of the OpenCL backend, calls OpenCLWorkspace::StreamSync. That's when we added our tracing code:
void OpenCLWorkspace::GetAttr(Device dev, DeviceAttrKind kind, TVMRetValue* rv) {
   this->Init();
@@ -441,6 +453,29 @@ void OpenCLWorkspace::StreamSync(Device dev, TVMStreamHandle stream) {
   this->Init();
   ICHECK(stream == nullptr);
   OPENCL_CALL(clFinish(this->GetQueue(dev)));
+
+  auto& evt_queue = this->GetEventQueue(dev);
+  for (size_t i = 0; i < evt_queue.size(); ++i) {
+    cl_ulong start = 0, end = 0;
+    cl_int err1 = clGetEventProfilingInfo(evt_queue[i], CL_PROFILING_COMMAND_START,
+                                          sizeof(cl_ulong), &start, nullptr);
+    cl_int err2 = clGetEventProfilingInfo(evt_queue[i], CL_PROFILING_COMMAND_END, sizeof(cl_ulong),
+                                          &end, nullptr);
+    if (err1 == CL_SUCCESS && err2 == CL_SUCCESS) {
+      perfReportBuffer << "OpenCL Kernel '" << queueIdxToKernelNameMap[i] << "' (event " << i
+                       << ") execution time: " << ((end - start) / 1e6) << " ms at time "
+                       << queueIdxToTimestampMap[i] << " ms\n";
+    } else {
+      LOGE("Failed to get profiling info for event %zu", i);
+    }
+  }
+  queueIdxToKernelNameMap.clear();
+  queueIdxToTimestampMap.clear();
+  evt_queue.clear();
}
To enable OpenCL’s profiling functionality, we needed to enable the OpenCL queue profiling by creating the queue via clCreateCommandQueueWithProperties with enabled property CL_QUEUE_PROFILING_ENABLE. A suitable place for this is void OpenCLWorkspace::SetDevice(Device dev), where we added one line that uses TVM’s helper performing clCreateCommandQueueWithProperties:
EnableQueueProfiling(dev, true);However, there was one technical difficulty.
We encountered an undefined symbol linker error when building our application. This occurred, because TVM’s OpenCL wrapper uses FFI to call into OpenCL. It was necessary to declare & define the following function in opencl_wrapper.cc:
cl_int clGetKernelInfo(cl_kernel kernel, cl_kernel_info param_name, size_t param_value_size,
                       void* param_value, size_t* param_value_size_ret) {
  auto& lib = LibOpenCLWrapper::getInstance();
  auto func = (f_clGetKernelInfo)lib.getOpenCLFunction("clGetKernelInfo");
  if (func) {
    return func(kernel, param_name, param_value_size, param_value, param_value_size_ret);
  } else {
    return CL_INVALID_PLATFORM;
  }
}
The final step was to invoke the TVMWriteKernelProfilingReport method. We did this in the same location where we previously called this->engine_->DumpJSON(); from: JSONFFIEngineImpl::GetResponseFromStreamOutput at the end of text generation.
Profiling results
Finally, we were able to obtain the following results after parsing our report:
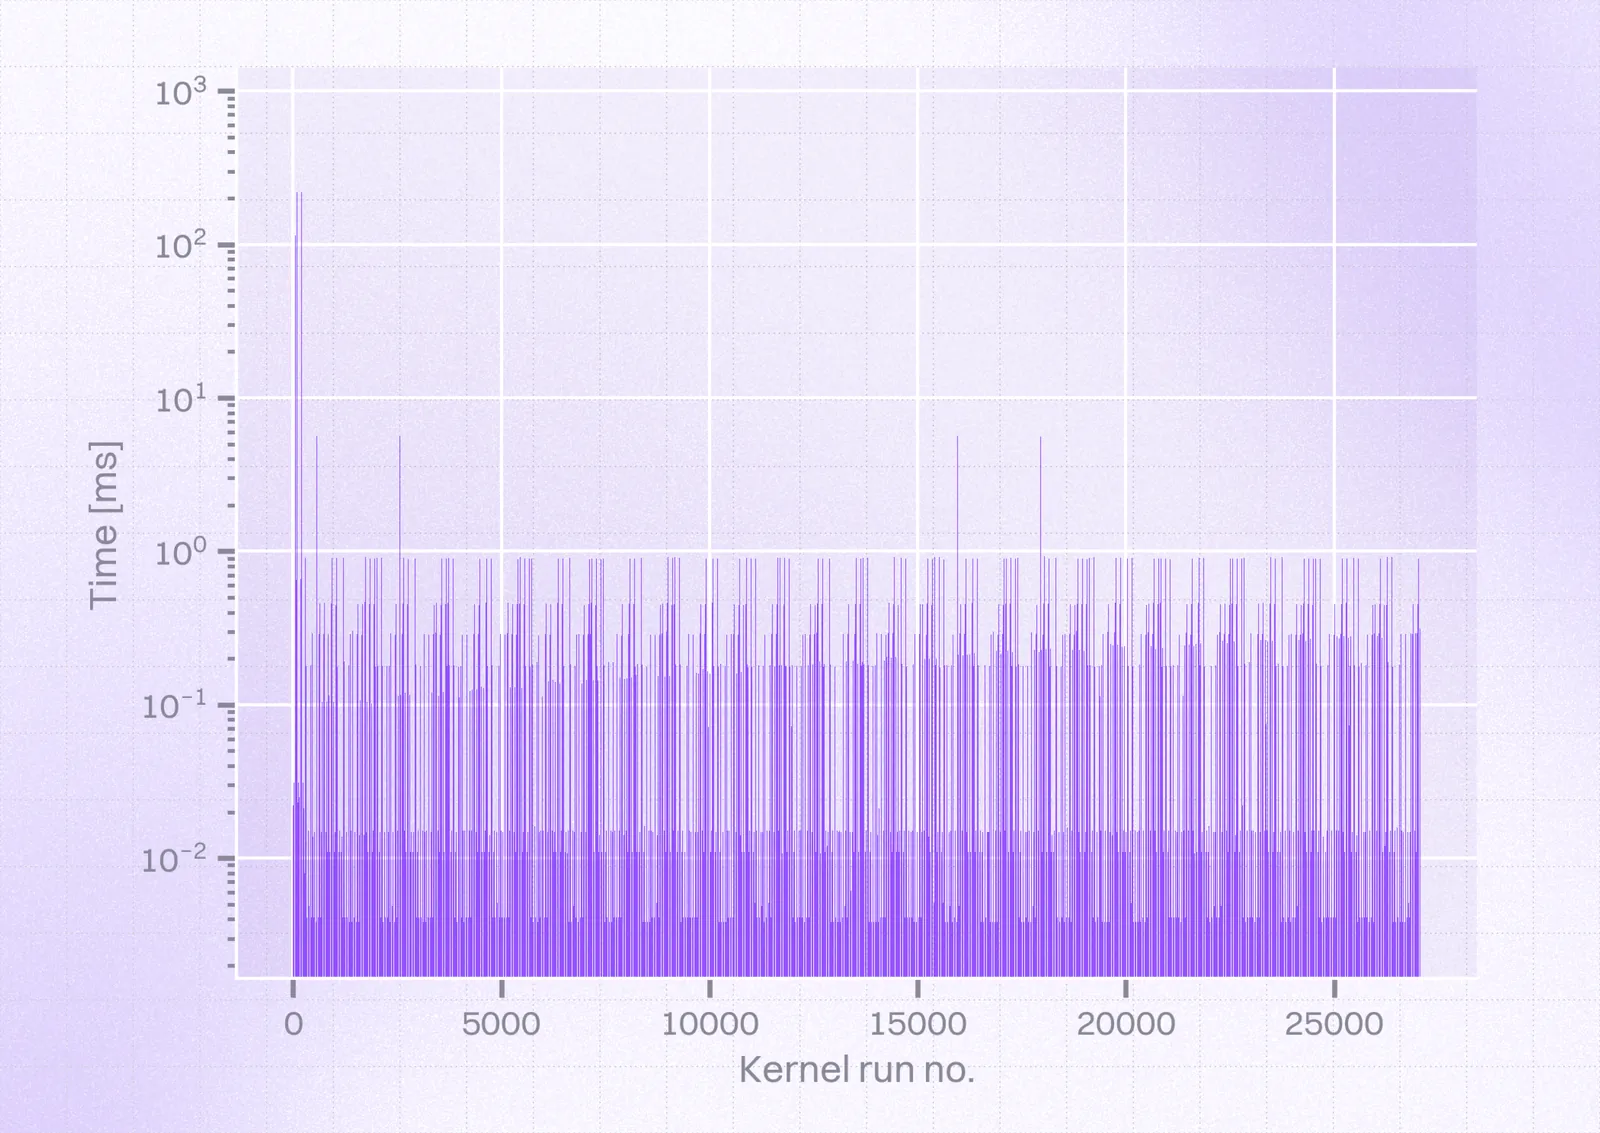
In contrast, this is how they should’ve looked:
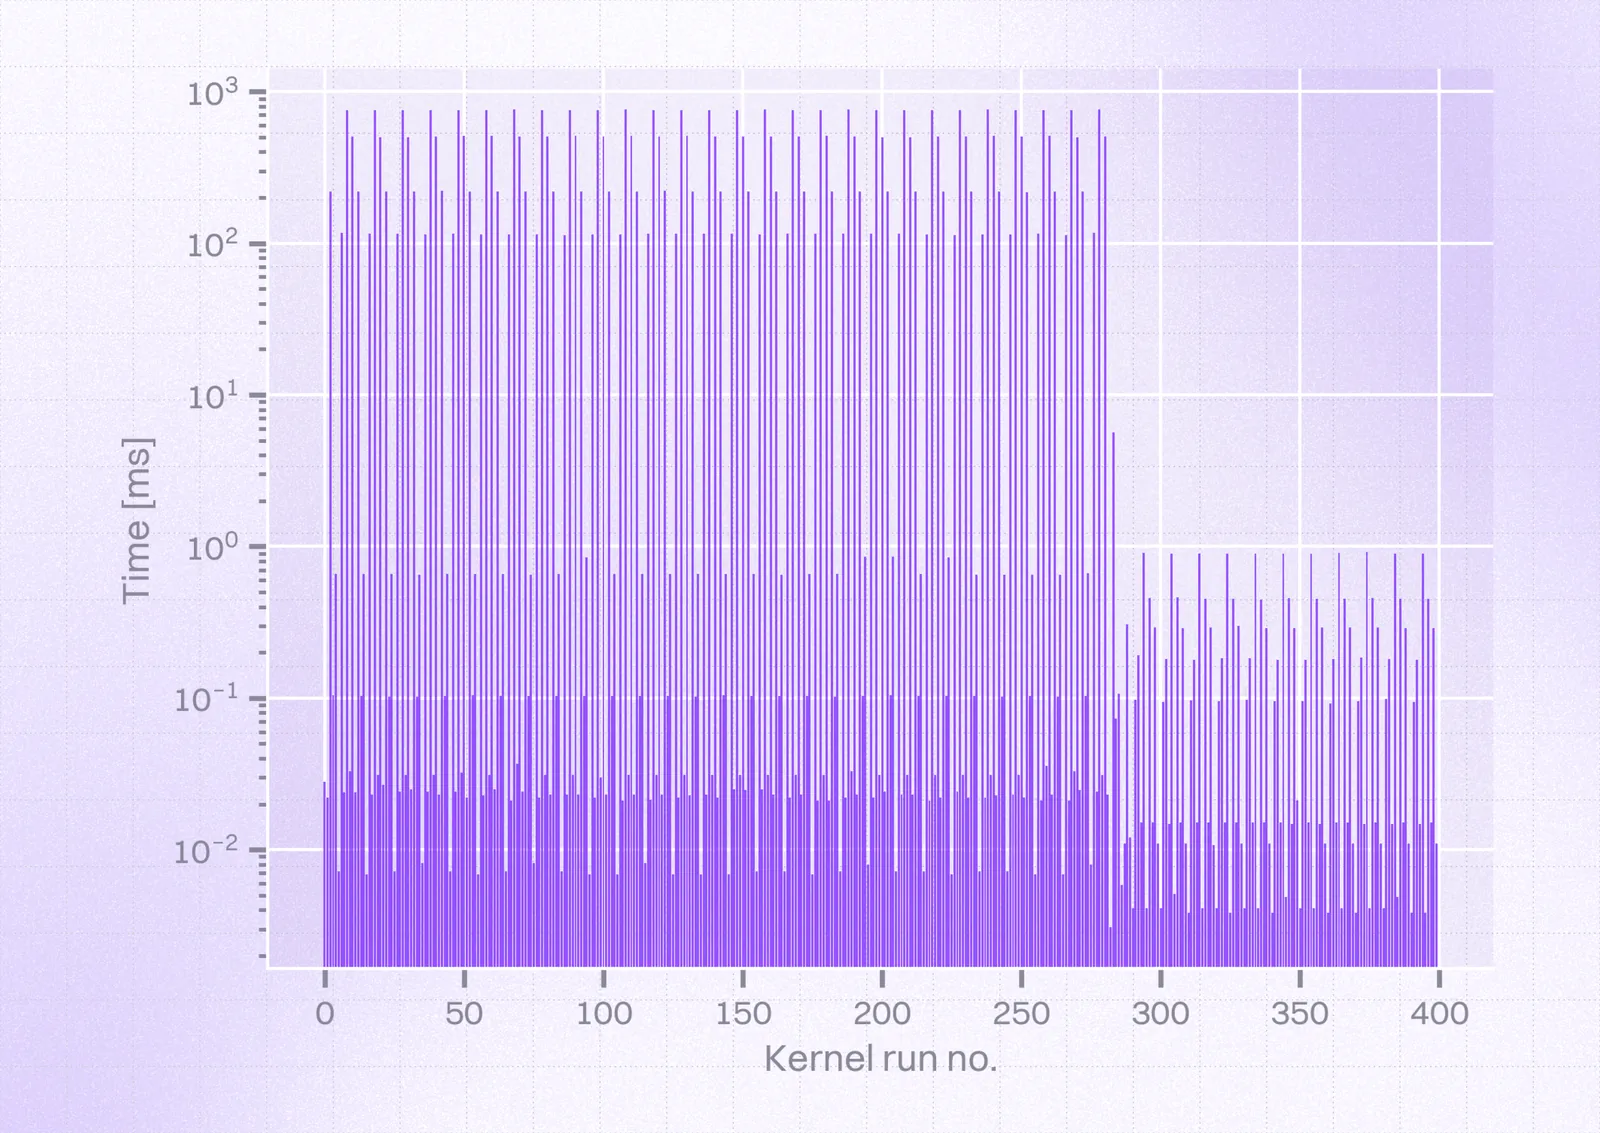
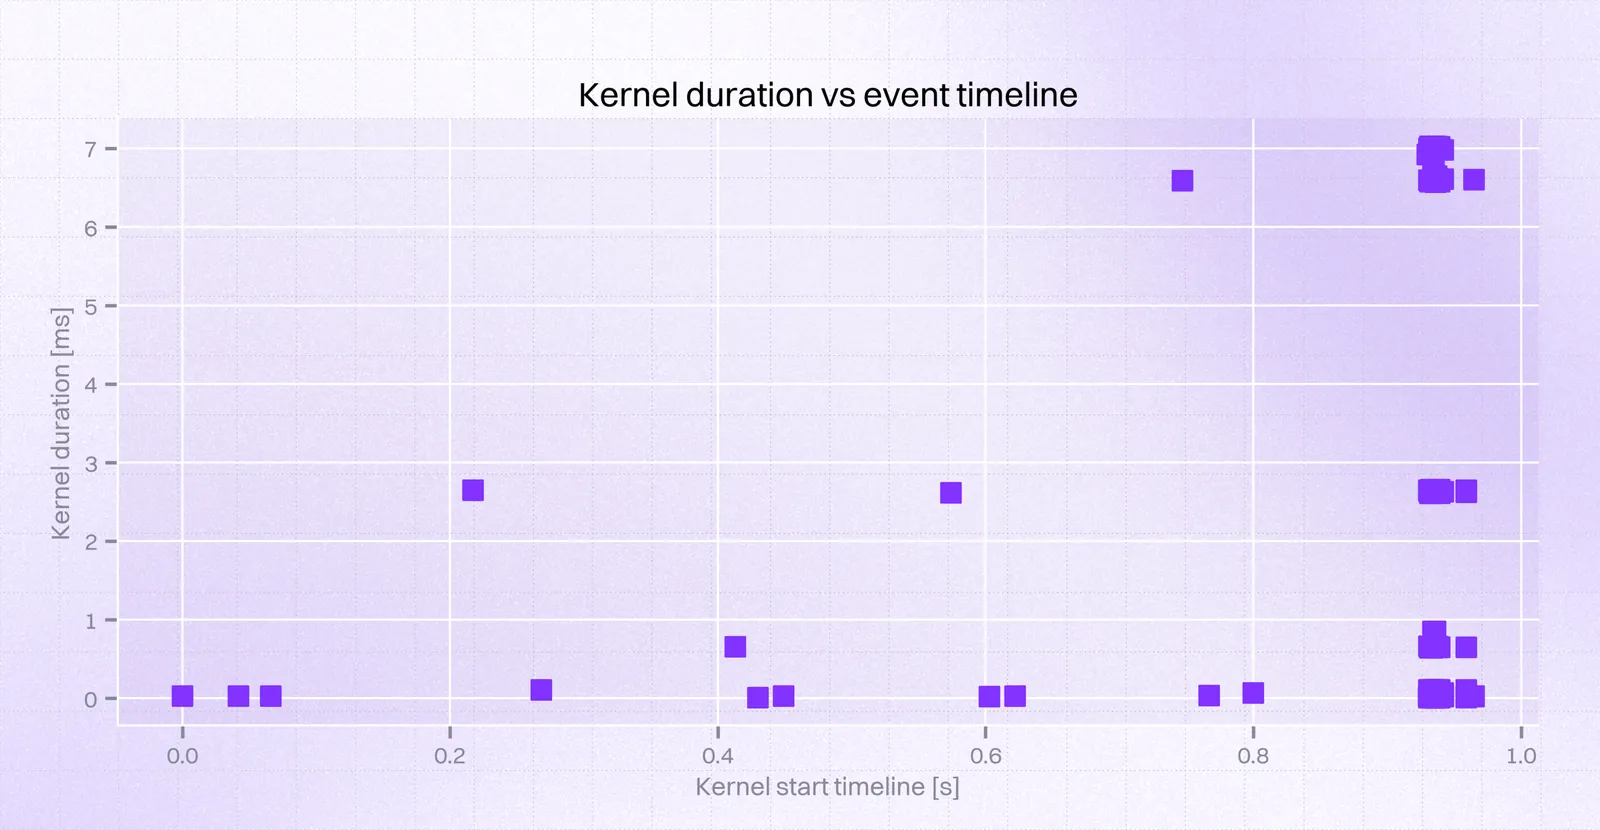
So, we could see a few kernels ($56$ that took over $0.4s$, including $28$ that took over $0.6s$) at the very beginning took $\approx1000ms$ instead of $0.7ms$. Taking a closer look at this time frame, we could obtain the following view:
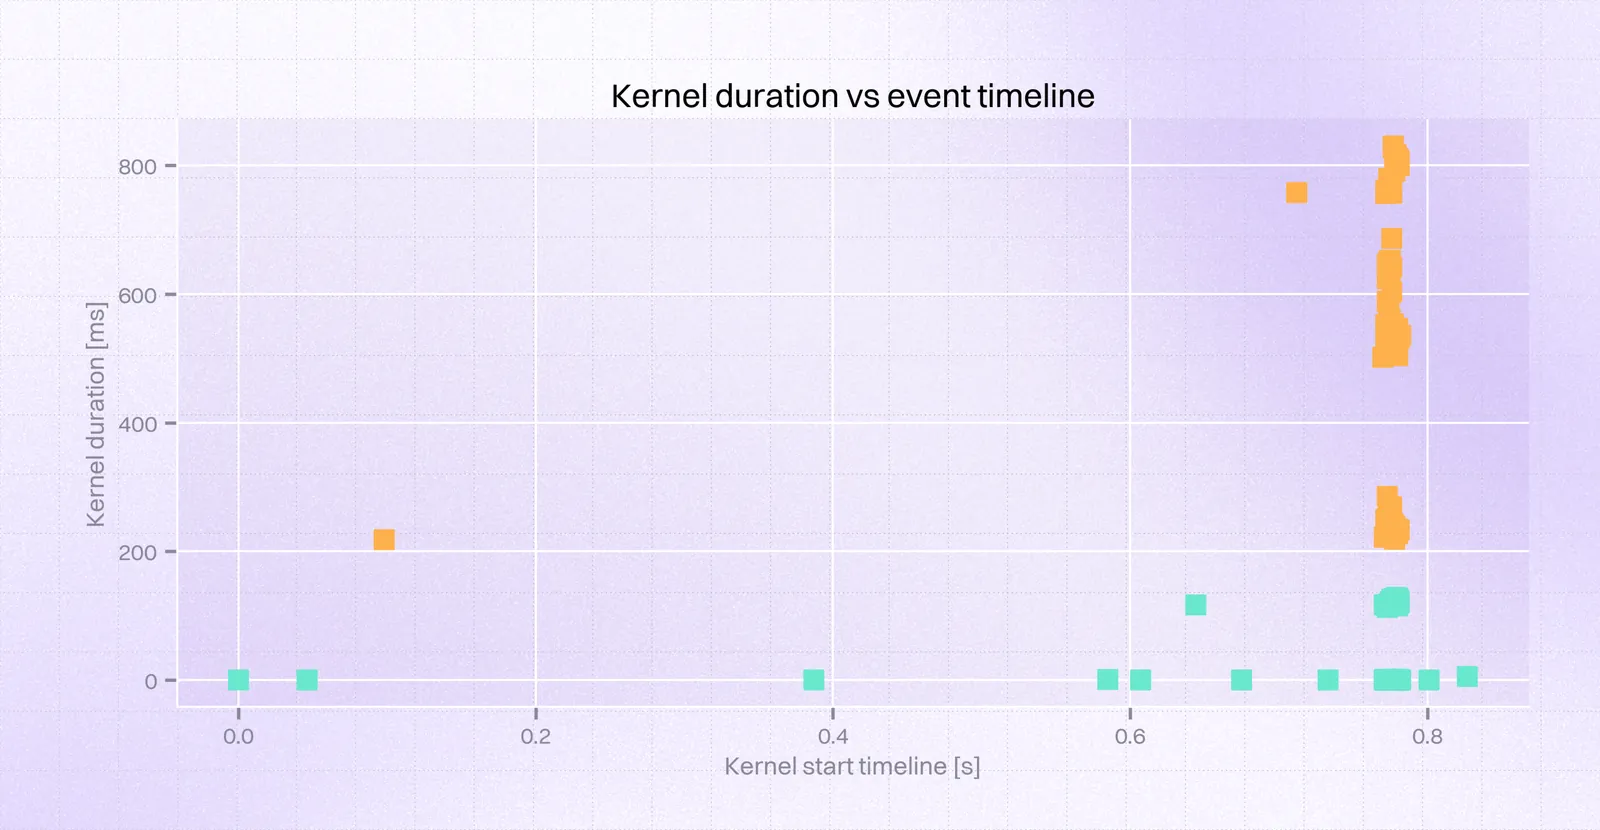
.png)
It comes down to 3 kernels being the cause of the problem. This can be neatly visualized on a violin plot:
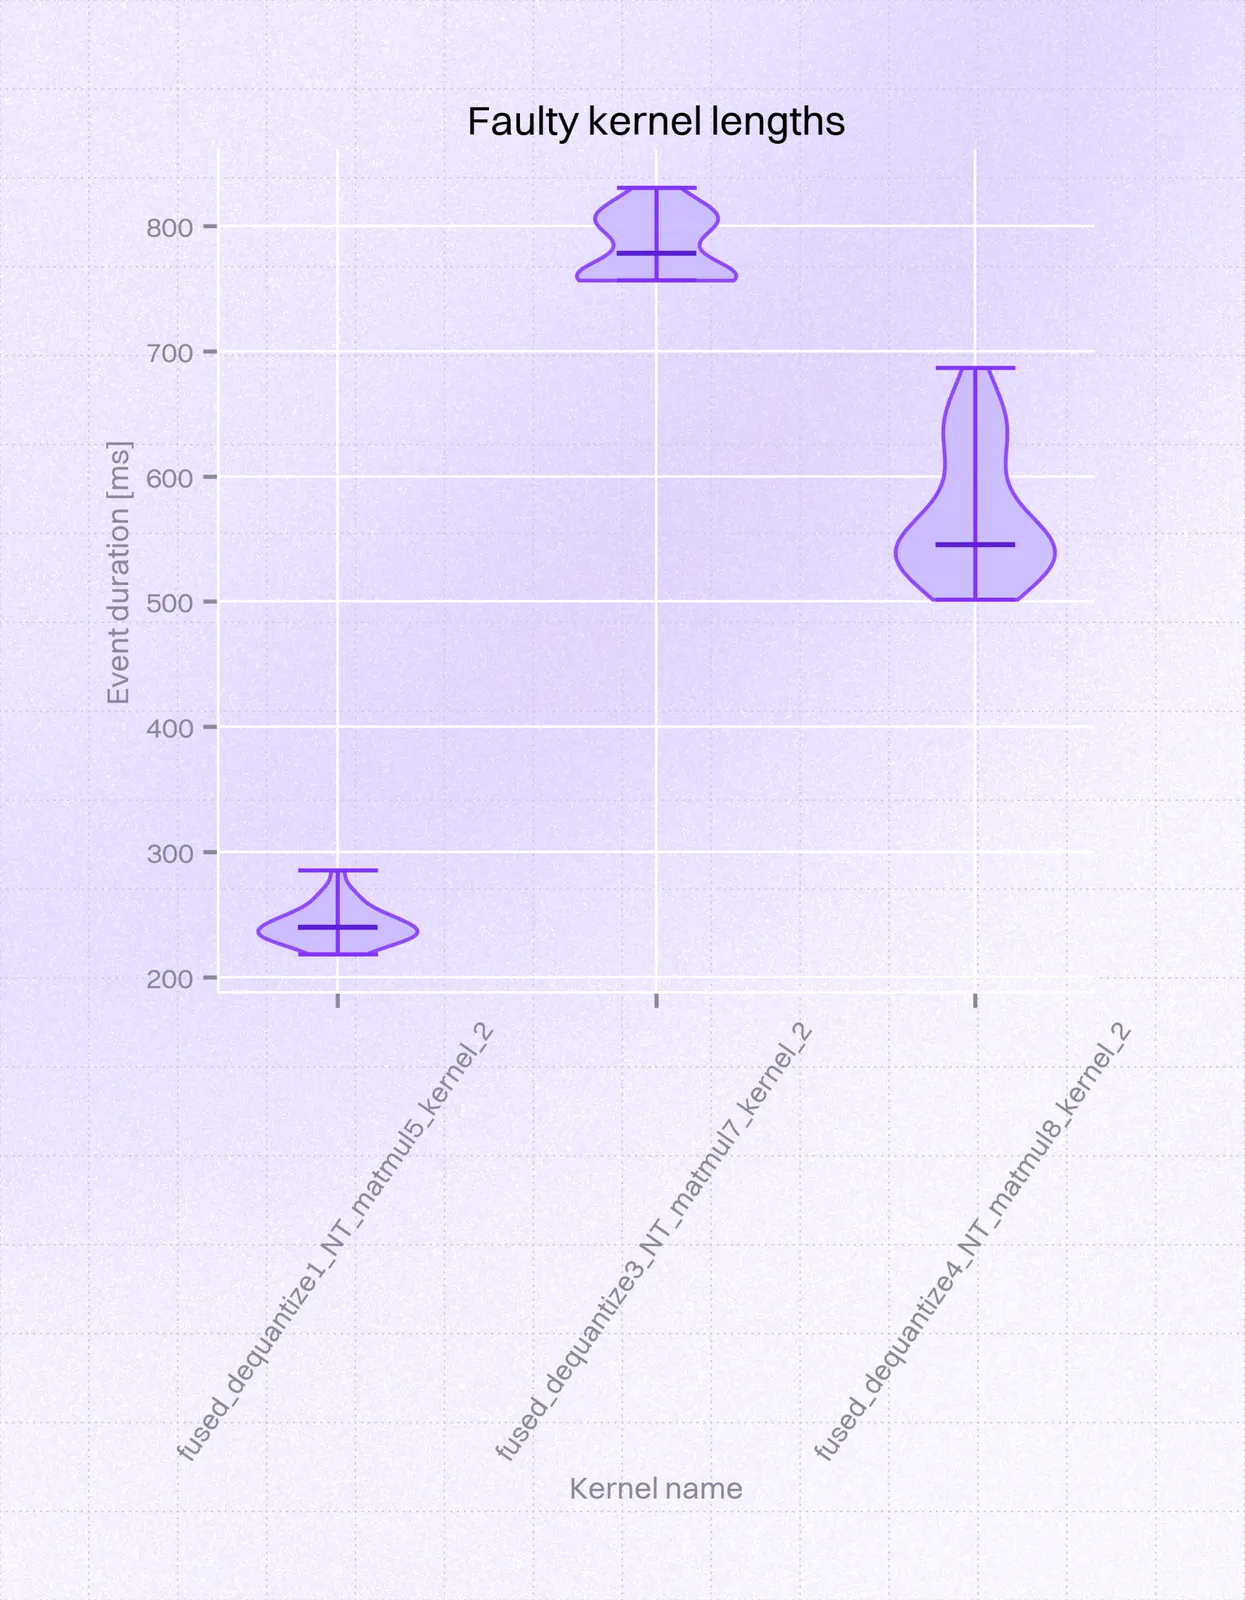
While the working version produced the following traces:
Conclusion and workaround
In cooperation with the researcher and maintainer of the MLC-LLM, Ruihang Lai, we were able to come up with the following conclusion: the difference between the working and non-working case was in the LLM model format. Models suffixed with _1, such as HF://mlc-ai/Llama-3.2-3B-Instruct-q4f16_1-MLC, have a transposed weight layout compared to ones with _0 suffix. Otherwise, those models are equivalent; the difference is purely the convention of the matrices carrying model weights and therefore the _1 format needs to be transposed.
We were able to confirm with Ruihang that, for unknown reasons, it takes much longer to compute the same operations with the _1 format, even though inspecting the code paths handling this difference doesn't seem to have any impactful differences compared to _0. It may even be that the memory layout of Adreno chips is more efficient in computing the operations in the _0 weight layout. While this investigation did not help find a definite fix for the _1 model format, it pinpointed which exact operations are slow (fused_dequantize_*_NT_matmul). If fixing this had been critical, one could attempt to find a more performant set of operations to achieve the same mathematical operation.
Therefore, the workaround, which we shipped in @react-native-ai/mlc, was to use the _0 model format. It is equivalent to _1 in all model quality (number of parameters, quantization, etc.), but the prefill for for _0 is much faster on Adreno. For the future users of the library, we also contributed a ‘known issues’ section to MLC-LLM’s section so that this does not come as an unpleasant surprise.


Learn more about AI
Here's everything we published recently on this topic.