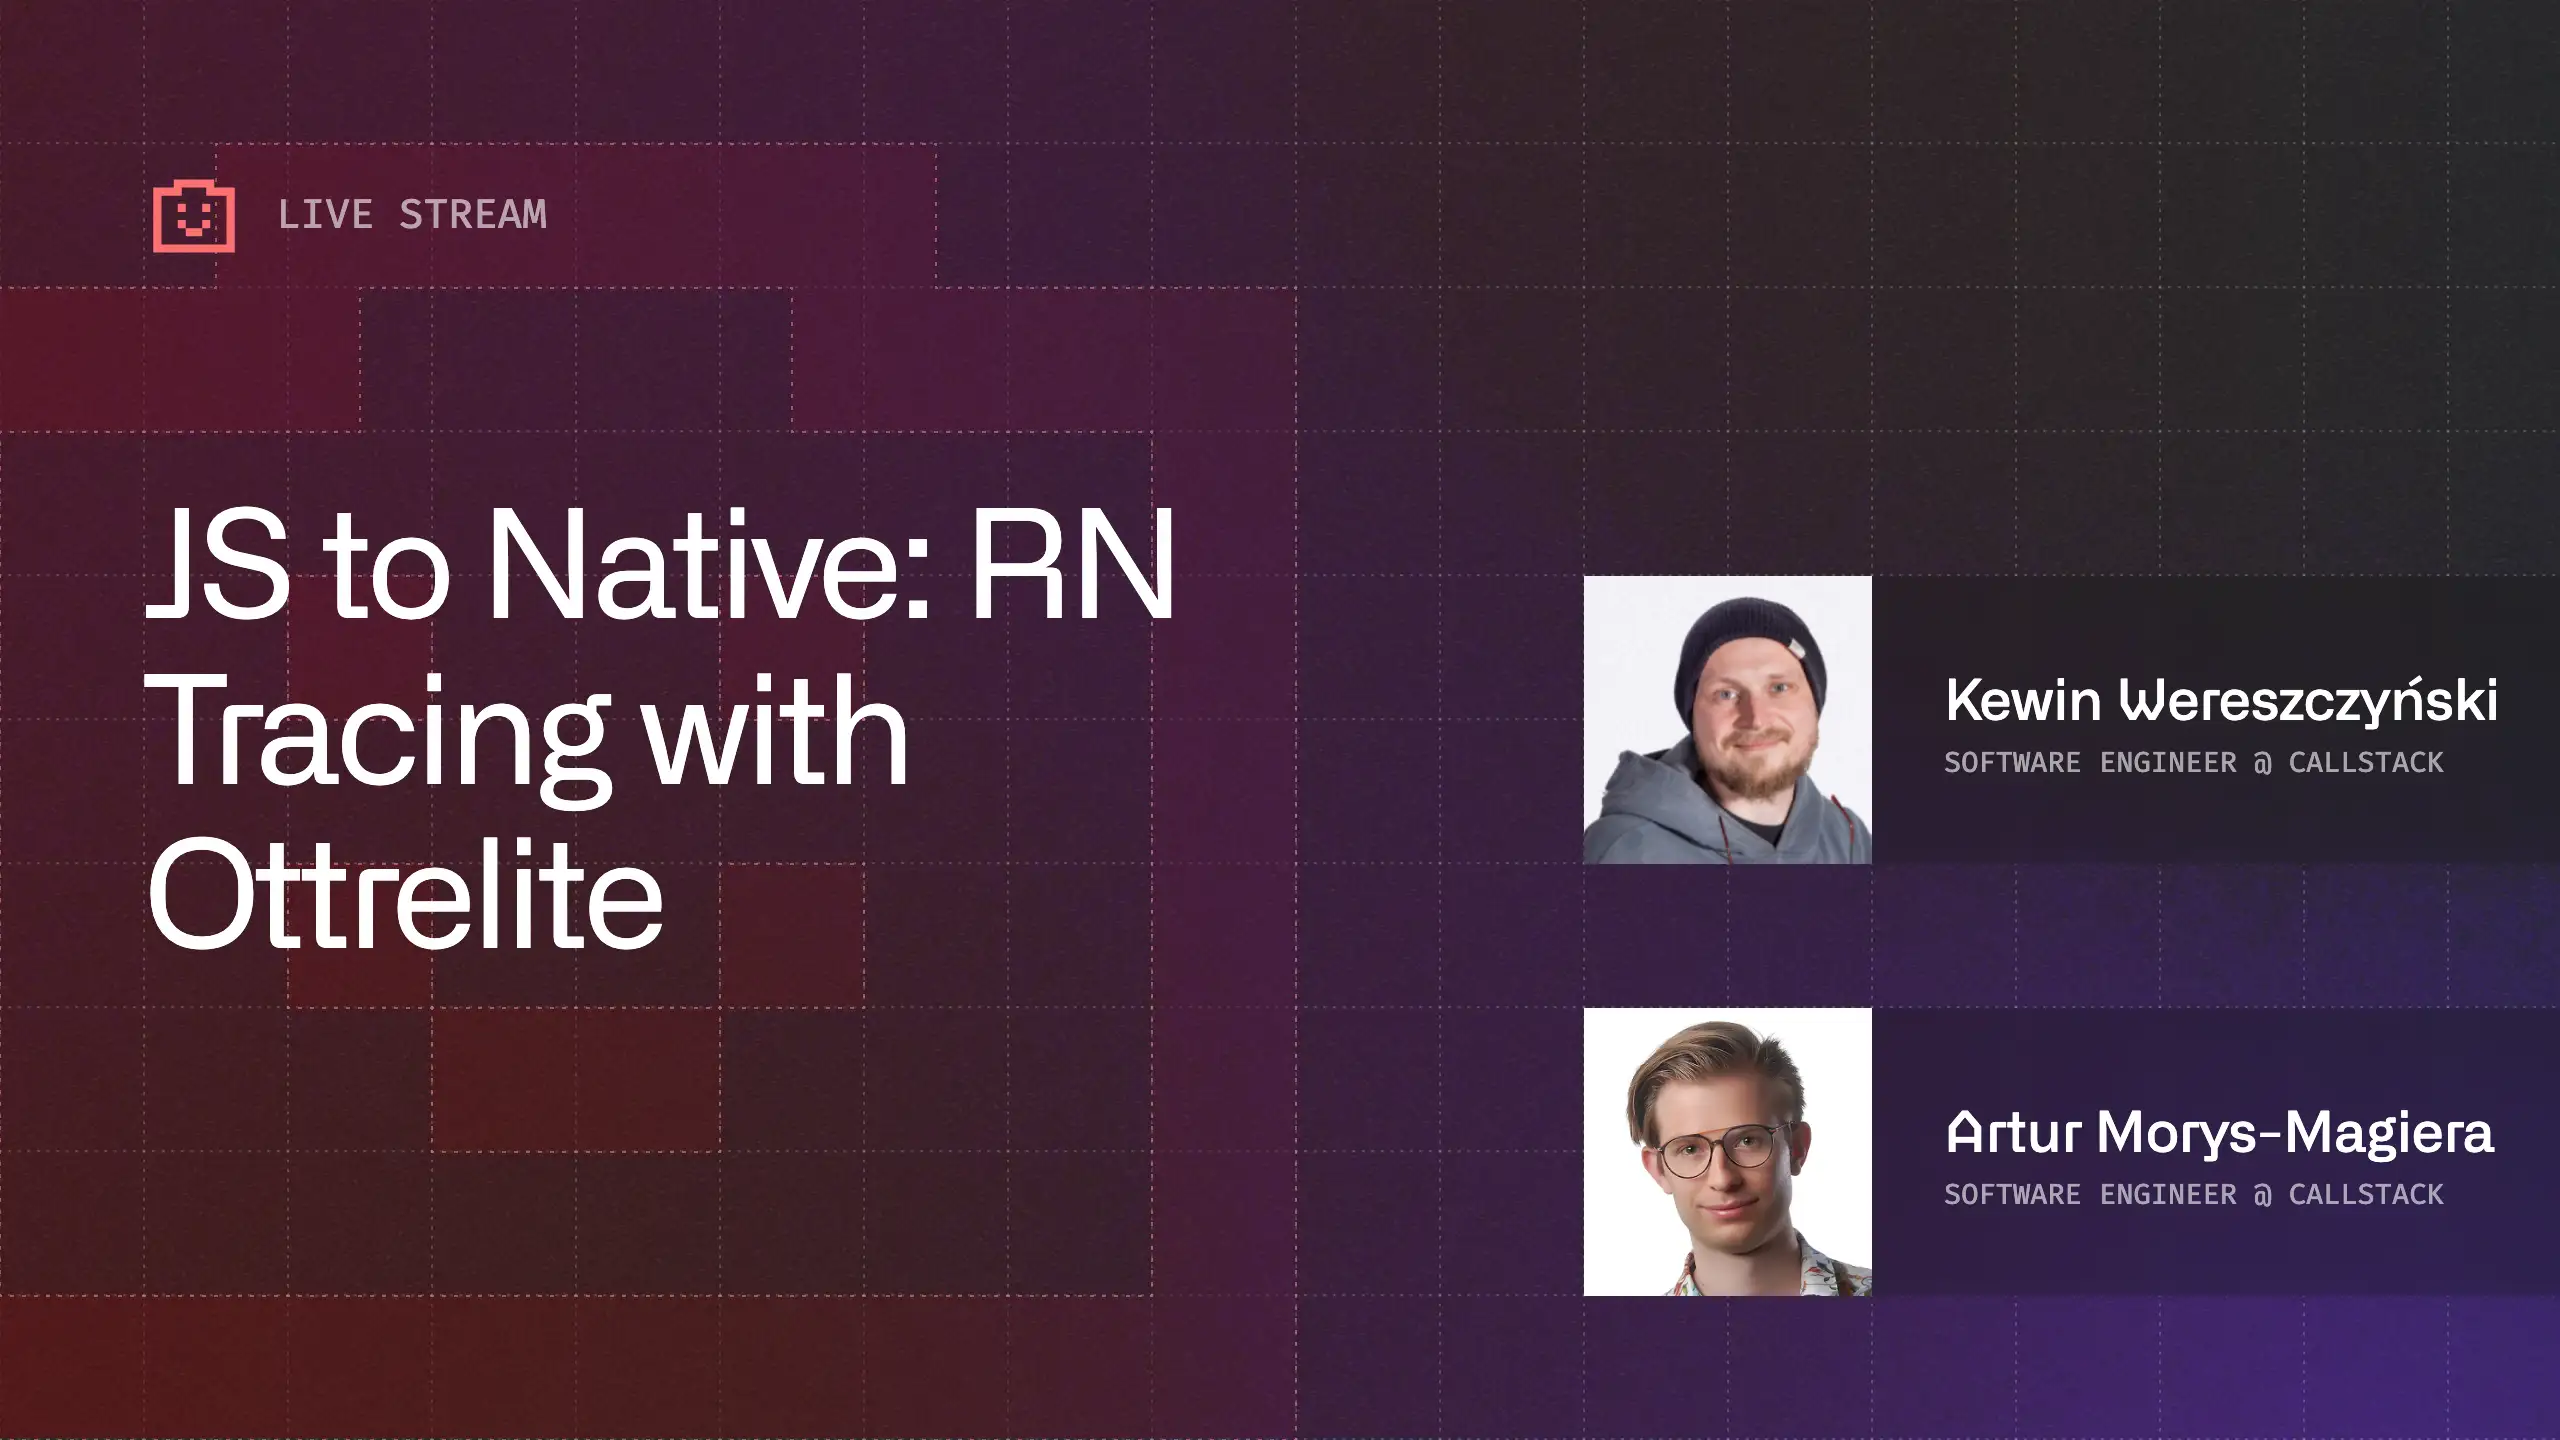
Performance Tracing in React Native with Ottrelite
Performance Tracing in React Native with Ottrelite
Live stream on tracing React Native performance with Ottrelite. See how to profile JS, C++, and Java code and connect to external profilers.
Performance Tracing in React Native with Ottrelite

In this live stream hosted by Kewin Wereszczyński and Artur Morys-Magiera, we’ll explore how to trace the performance of React Native applications using Ottrelite: a unified, extensible tracing library built for real-world apps.
You’ll see how to trace selected execution paths in JavaScript, C++, and Java native modules, and how to integrate Ottrelite with external profilers to get a complete view of your app’s behavior. Expect to see some hands-on techniques you can apply right away.
Performance Tracing in React Native with Ottrelite
Live stream on tracing React Native performance with Ottrelite. See how to profile JS, C++, and Java code and connect to external profilers.

Learn more about
Observability
Here's everything we published recently on this topic.
We can help you move
it forward!
At Callstack, we work with companies big and small, pushing React Native everyday.
Release Process Optimization
Ship faster with optimized CI/CD pipelines, automated deployments, and scalable release workflows for React Native apps.

React Native Performance Optimization
Improve React Native apps speed and efficiency through targeted performance enhancements.
Quality Assurance
Combine automated and manual testing with CI/CD integration to catch issues early and deliver reliable React Native releases.
Scalability Engineering
Design and validate React Native architectures that scale-supporting high traffic, modular teams, and long-term performance.
Code Sharing
Implement effective code-sharing strategies across all platforms to accelerate shipping and reduce code duplication.


